Introduction
The JOC Cockpit Dashboard is an interface view that provides users with an overview of the activities of a JobScheduler and a starting point for accessing information and managing scheduling activities. In addition a number of functions can be executed directly from the Dashboard.The Dashboard View is made up of the standard JOC Cockpit header menus and the Dashboard itself, which is made up from a number of widgets as shown in the following screenshot:
The Dashboard is the default view that is opened after a user logs onto the JOC Cockpit.
The JOC Cockpit Header Menus
The JOC Cockpit header menus are the same for all views and provide the following functions:
- JobScheduler Master selection (in the top row at the right hand end).
- View selection (the left hand portion of the bar with the dark gray background).
- Access to the User Profile menu (the right hand end of the bar with the dark gray background).
The JOC Cockpit header menus are described in more detail in the JOC Cockpit - Navigation and Usability article.
The Dashboard View Widgets
The Dashboard View is made up of the following widgets:
Agent Cluster Status
This widget shows summary of the status of all the agent and/or agent clusters in the environment. Three statuses are possible:
Healthy - the agents or clusters that are running ok,
Unhealthy - only applies for a cluster - where one or more agents in the cluster are not working,
Unreachable - where an agent or cluster is not responding.
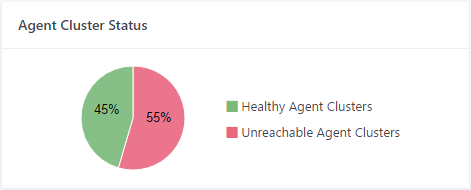
- Clicking the links in the widget opens the Resources View with the Agent Clusters having the relevant status being shown.
Agent Cluster Running Tasks
- The goal of this widget is to show at a glance the number of tasks running on each Agent Cluster.
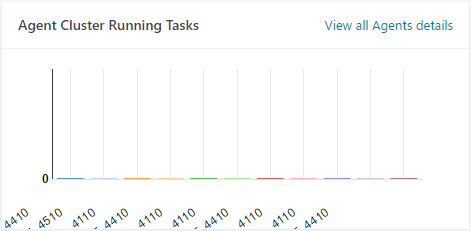
- The View all Agents details link opens the JOC Cockpit Resources tab showing the Agent Clusters view with All Agent Clusters.
- The goal of this widget is to show at a glance the number of tasks running on each Agent Cluster.
Master Cluster Status
- This widget provides an overview of the operational status and health of a JobScheduler Master or JobScheduler Master Cluster.
It covers the range of JobScheduler architectures e.g. standalone, passive cluster, active cluster etc.
- The widget provides basic information - architecture, distribution, etc. - about a JobScheduler or Cluster on mouse-over as shown in the screenshot below.
- The Menu select box is only shown for JobScheduler Master Clusters and is used to operate all the JobSchedulers in the Cluster, apart from a Supervisor JobScheduler, if any. The functions available include Restarting the whole cluster, Terminating Immediately, etc.
- Controls are also available for pausing, restarting, terminating and aborting individual JobSchedulers, as shown in the screenshot. These controls are available for standalone JobSchedulers or cluster members.

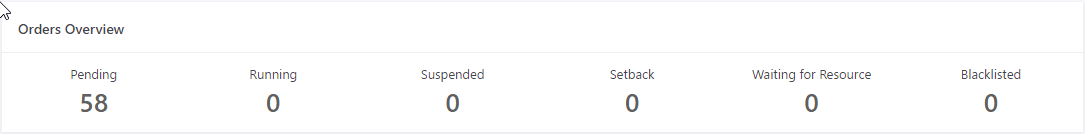
Orders Overview
- This widget show a current summary of the orders being processed by the selected JobScheduler or JobScheduler Cluster and their states e.g. the orders running, setback orders, suspended, etc.
- The functions attached to this widget are dynamic. Where orders are noted as having a state - in the screenshot shown below this would be the states Pending and Suspended - a link to is provided to show an overview of those orders with the state in question.
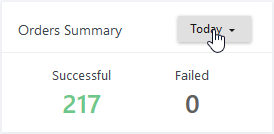
Orders Summary
- This widget shows a summary of the orders that have been processed and the results they returned, e.g. successful or failed.
- The drop-down menu shown in the screenshot allows selection of the time period.
- The number of Successful and Failed orders shown provide a direct link to the History View, with the number of orders that were either successful or had failed in the last 12 hours being shown by default.
Daily Plan Overview
The goal of this widget is to give users a quick overview of how the Daily Plan is progressing.
- Clicking on the text links in the widget opens the Daily Plan view showing the orders for the time period and result specified.
