Introduction
The JOC Cockpit Dashboard is an interface view that provides users with an overview of the activities of a JobScheduler and a starting point for accessing information and managing scheduling activities. In addition a number of functions can be executed directly from the Dashboard.
The Dashboard is made up from a number of widgets as shown in the following screenshot: SCREENSHOT TO BE REPLACED
The Dashboard is the default view that is opened after a user logs onto the JOC Cockpit.
Dashboard View Widgets
The Dashboard view is made up of the following widgets:
Agent Cluster Status
This widget shows summary of the status of all the agent and/or agent clusters in the environment - that is the number of agents / clusters that are running ok, the number that have problems and the number that are unreachable.
- Clicking the widget opens the Agent Clusters tab of the Resources View.
Agent Cluster Running Tasks
- The goal of this widget to show at a glance the number of tasks running on each agent cluster.
- The View all Agents details link opens the Cockpit Resources tab showing the Agent Clusters view with All Agent Clusters.
Master Cluster Status
- This widget provides an overview of the operational status and health of a JobScheduler environment.
It covers the range of JobScheduler architectures e.g. standalone, passive cluster, active cluster etc.
- The widget provides basic information - architecture, distribution, etc. - about every JobScheduler on mouse-over as shown in the screenshot below.
- The Menu select box in the widget allows all JobSchedulers in the environment apart from the Supervisor JobScheduler to be restarted or terminated immediately.
- Controls are also available for restarting, terminating and aborting individual JobSchedulers as shown in the screenshot:
Orders Overview
- This widget show a current summary of the orders being processed by the selected JobScheduler and their states e.g. the orders running, setback orders, suspended, etc..
- The functions attached to this widget are dynamic. Where orders are noted as having a state - in the screenshot shown below for the states Pending and Suspended - a link to is provided to show an overview of those orders with the state in question.
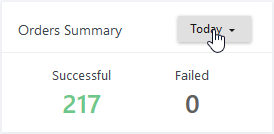
Orders Summary
- This widget show a summary of the orders being processed and their states e.g. the orders running, setback orders, suspended, etc..
- The drop-down menu shown in the screenshot allows selection of the time period.
- There is no function attached to this widget.
Daily Plan Overview
The goal of this widget is to give users a quick overview of how the Daily Plan is progressing.
- Clicking on the text links in the widget opens the Daily Plan tab showing the orders for the time period and result specified.