...
- In the Job Chain Flow Diagram presentation described in the previous section, open the Order's Additional Options menu by clicking in the ellipsis symbol above the first job in the job chain and start the hello_world_order by selecting the Start Order Now option. This will open the Write a Comment form shown in the next screenshot. Comments are included in the the JobScheduler Web Service Audit Log. See the JOC Cockpit - Audit Log article for more information.

Clicking on the Submit button as shown in the above screenshot will start the Order.
- You will now be able to follow the progress of the Order along the Job Chain in near real-time.
The screenshot below shows the order being processed at the second job.
In addition, the Order History table at the foot of the screenshot will show the current Order Status of processing, the Start Time, the processing Duration and the Node currently being processed - also in near real-time.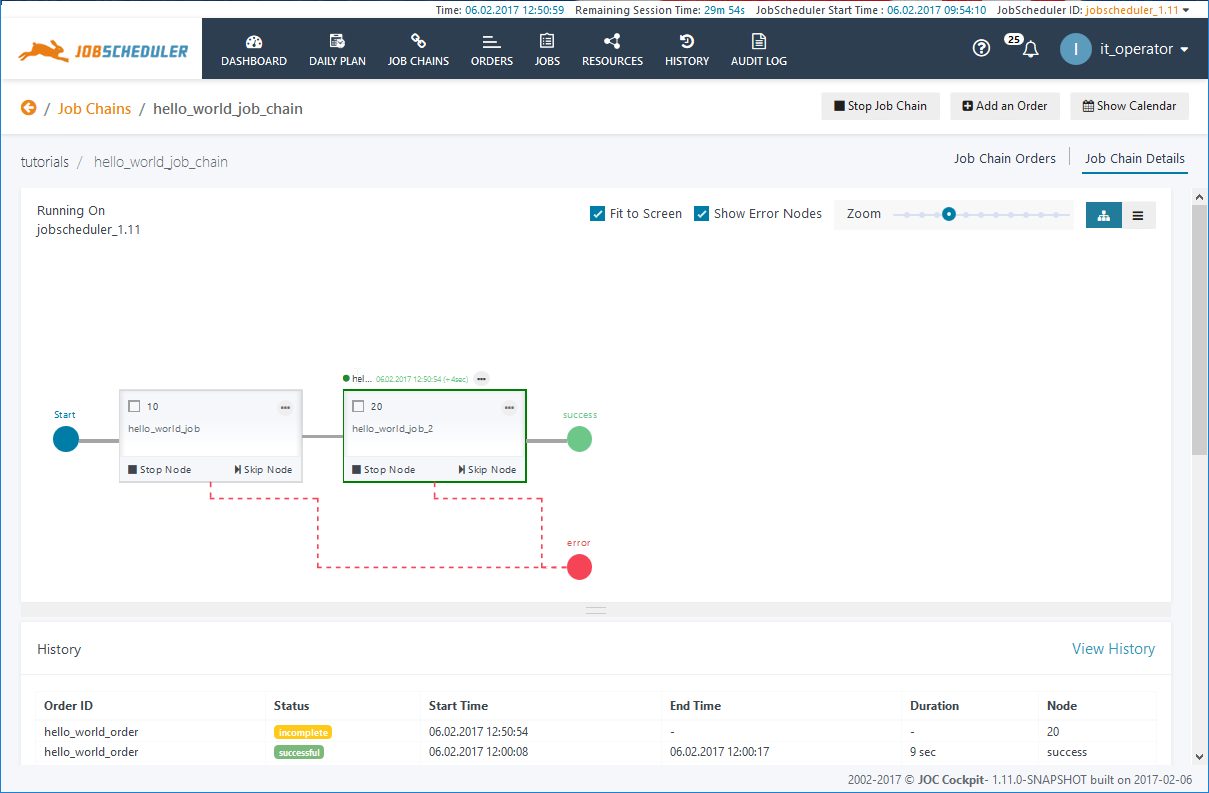
Note that the Add an Order button at the top right of the View could have been used to access the Add New Order form with the possibility of setting a Run Time and Parameters.
- As described in Tutorial 1, the links behind the entries in the History table below the flow diagram can be used to open the Order Log File.
- The Operation just carried out as part of this tutorial can now be seen in the Audit Log as shown in the next screenshot.
In addition to providing a compliance-conform record of Who-did-what this is intended to provide operators with useful information in addition to the History, for example, after a change of shift.