Starting Situation
- Instead of the plain old tabular visualization in report files, users can add a more lively visual design to their Excel® reports by using the Import Excel Module.
- Reports start as usual with data in rows and columns, however, with the choice of colors, Pivot Tables, and Charts a design is available that suggests better visualization and better decision making.
Use Cases
The PowerShell CLI is used by jobs to create better designed reports. Two modules are applied for this purpose:
- the JobScheduler PowerShell Module
- a reporting PowerShell Module. This example makes use of the ImportExcel PowerShell Module that can be used to create Excel® reports and to add Pivot Tables and Pivot Charts to reports. The module can be operated for Windows and Linux computers and does not require prior installation of Microsoft Excel®.
Find a sample report: jobscheduler_designed_report.xlsx
Please consider that below jobs are examples that have to be adjusted to your environment.
Download the job: report_design_task_history_windows.job.xml
Explanations:
- Line 2-3: The job is executed with a Windows Agent that is assigned by a process class. The job is of type "PowerShell" and will use the PowerShell version provided with the server.
- Line 4-5: The required PowerShell modules are imported. They could be installed in any location in the file system.
- Line 7: The Connect-JS cmdlet is used to authenticate with the JOC Cockpit REST Web Service. The required URL and credentials are specified in a PowerShell profile, see PowerShell CLI 1.2 - Use Cases - Credentials Management
- Line 10: Create an object
$reportDatafrom the output of the Get-JSTaskHistory cmdlet in which a number of properties are selected and are specified for the sequence in which they should occur in the report. - Line 21: The location where the Excel file will be saved is specified with the
$xlsxFilevariable. - Line 23: Create a variable
$workSheetNamethat is used to store the name of the worksheet. - Line 25-30: Creates a spreadsheet and passes on the Excel Package object which provides the reference to the workbook and turns to the worksheets inside it.
$xlsxFilestores the path of the Excel® file.- If we are updating an existing worksheet and the new data wouldn’t completely cover the area consumed by previous data, then we may be left with “ghost” data. To ensure this doesn’t happen, we can use the
-ClearSheetoption to remove previous data in a worksheet. -PassThrureturns the Pivot Table so it can be customized.-AutoSizeparameter allows us to resize the columns of the spreadsheet to fit the data added and to get the column-widths right.- For adding color to conditional text
-ConditionalTextis used. Additional types of conditional format are supported. Here we use conditional text for the job status color like (successful=green, incomplete=orange, failed=red). To assign a name to the worksheet the
-WorksheetNameparameter is used. The default name of the worksheet is sheet1.- The -
IncludePivotTableand -IncludePivotChartparameters generate the Pivot Table and Pivot Chart. The parameter -ChartTypelets you pick what type of chart you want to use, there are many examples to choose from: Area, Line, Pie, ColumnClustered, ColumnStacked100, ColumnClustered3D, ColumnStacked1003D, BarClustered, BarOfPie, Doughnut, etc. - The -
PivotRowsand-PivotDataparameters describe how to tabulate the data.
- Line 34: The
-PivotTableNameparameter is used as the name for the new Pivot Table. - Line 35: By default, a Pivot Table will be created in its own worksheet, but it can be created in an existing worksheet. In the above job example the
$excel.$WorkSheetName.cells["K1"]parameter defines the cell in an existing worksheet where the pivot table will be created. - Line 36:
$excel.$WorkSheetNamerefers to the worksheet in which the source data are found. - Line 37: The
-PivotRowsparameter is used for fields to set as rows in the Pivot Table. - Line 38: The
-PivotDataparameter contains a hash table in the form "FieldName"="Function," where a function is one of Average(), Count(), CountNums(), Max(), Min(), Product(), None(), StdDev(), StdDevP(), Sum(), Var(), VarP(). - Line 39: To apply a table style to the Pivot Table the
-PivotTableStyleparameter is used. The PivotTableStyle “Medium6” is the default table style but there are plenty of others to choose from. Example: PivotTableStyles = None, Custom, Light1 to Light21, Medium1 to Medium28, Dark1 to Dark11".
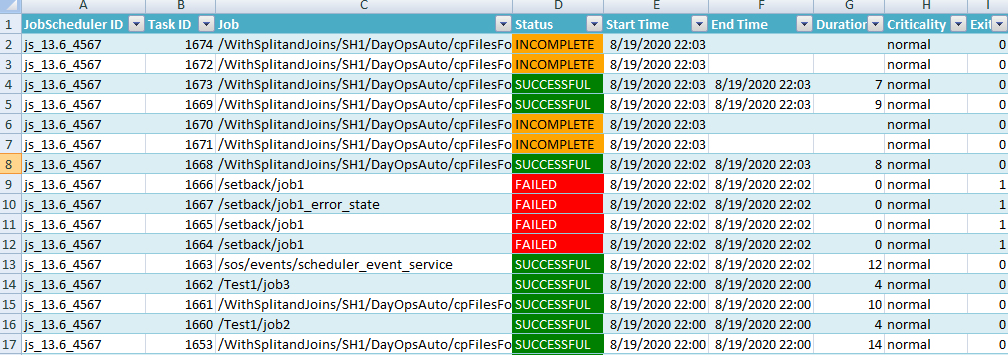
Sample Report Sheet with colorful status:
The below screenshot contains the output of the Get-JSTaskHistory cmdlet stored in the Excel report sheet. Users can change the colors of text and background of cells according to their choice. The below example presents the status of jobs with different colors using the
-ConditionalTextparameter of the ImportExcel module.
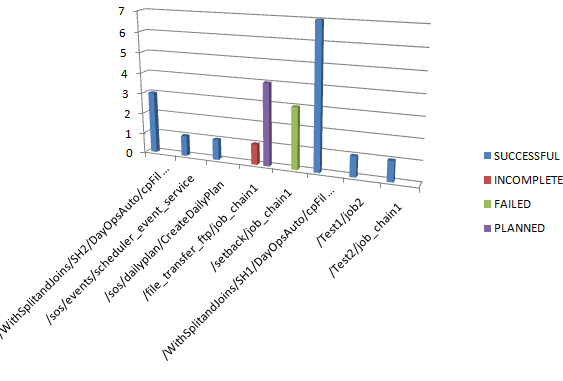
Sample Charts:
- There is a sample Pivot Chart created with the parameter
-ChartType ColumnClustered3D. This chart type is used in this example to display the number of jobs per state (successful, incomplete, failed, planned) of jobs.
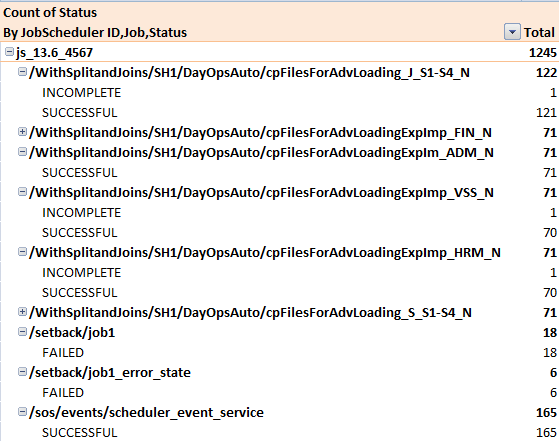
Sample Pivot Table:
- The sample Pivot Table displays the RowHeaderCaption as "By JobScheduler ID, Job, Status". You can adjust the style of the table by use of the parameter
-PivotTableStyle. Users can expand and collapse the Pivot Table.