This article only applies to the Classic JOC Interface
The Classic JOC user interface is entering retirement:
FEATURE AVAILABILITY ENDING WITH RELEASE 1.11
The JOC Cockpit user interface is a replacement for the Classic JOC interface:
FEATURE AVAILABILITY STARTING FROM RELEASE 1.11
See the JOC Cockpit Articles for more information about the JOC Cockpit.JobScheduler Operations Center
The JobScheduler Operations Center (JOC) is used to monitor and control the jobs, job chains and orders.
You open JOC in a browser with the URL:
where scheduler_host and scheduler_port are the hostname and the TCP port number of the JobScheduler.
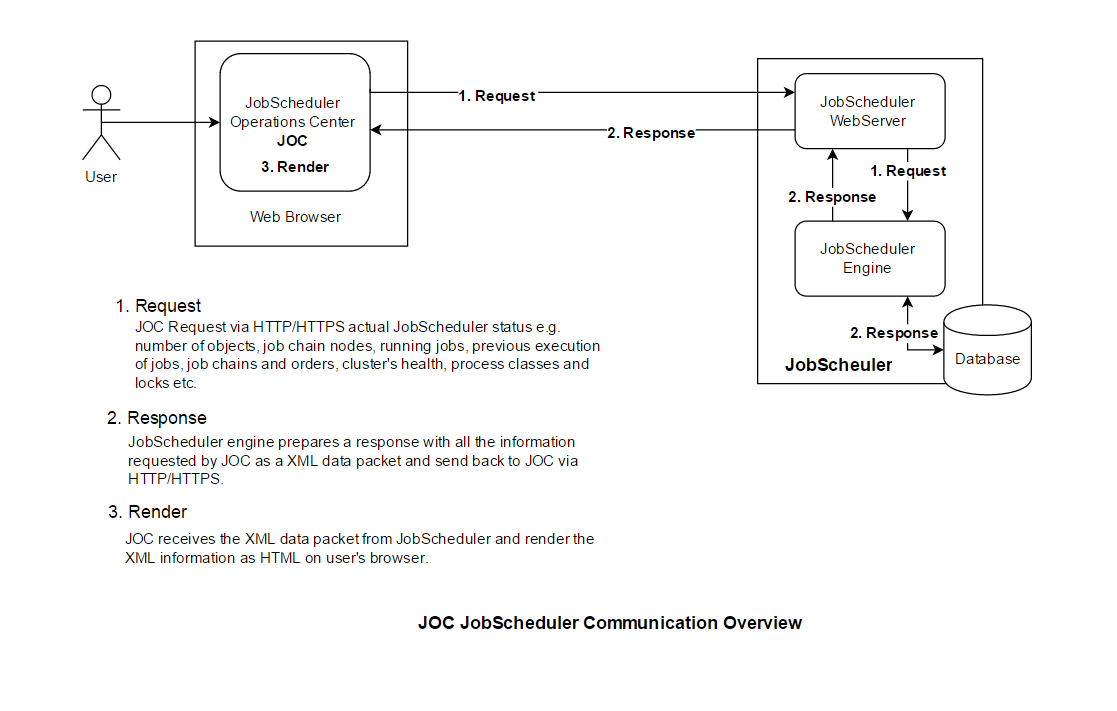
Overview Communication Between JOC and JobScheduler Engine
Factors affects JOC Performance
Size of data packet
- One of major factor affecting data packet sent back by JobScheduler depend upon number JobScheduler objects e.g. job chain, job, order, deployed in live folder.
Number of running jobs/tasks
- Number of running jobs/tasks also add addition run time information e.g. start time, end time, step text etc.
Number of history entries per order/task
- In JOC user can configure how many order/task histories he want to see. As number of order/task history is higher, JobScheduler engine needs more time to fetch that information from database. Also the data packet size will be bigger.
Auto update frequency
- By default auto update of JOC is disabled . But if user enable the Auto update
Database performance
- JobScheduler fetch history and status information from Database tables, as time progress database tables become too big and usual database performance problems such as no indexing, unoptimized queries plans etc started affecting JOC performance.
Network performance
- The JOC communicate with JobScheduler over LAN / local network. Usually enterprise networks are very fast but added layer of security. packet firewalls, zoned network etc add bit of latency. which also can affect the JOC performance.
JOC Performance Debugging
The JOC offers a feature to see in real time time taken by JobScheduler to prepare the data packet and transportation time to JOC. Also user can see rendering time required by JOC for different sections of the JOC GUI.
Enable Debugging
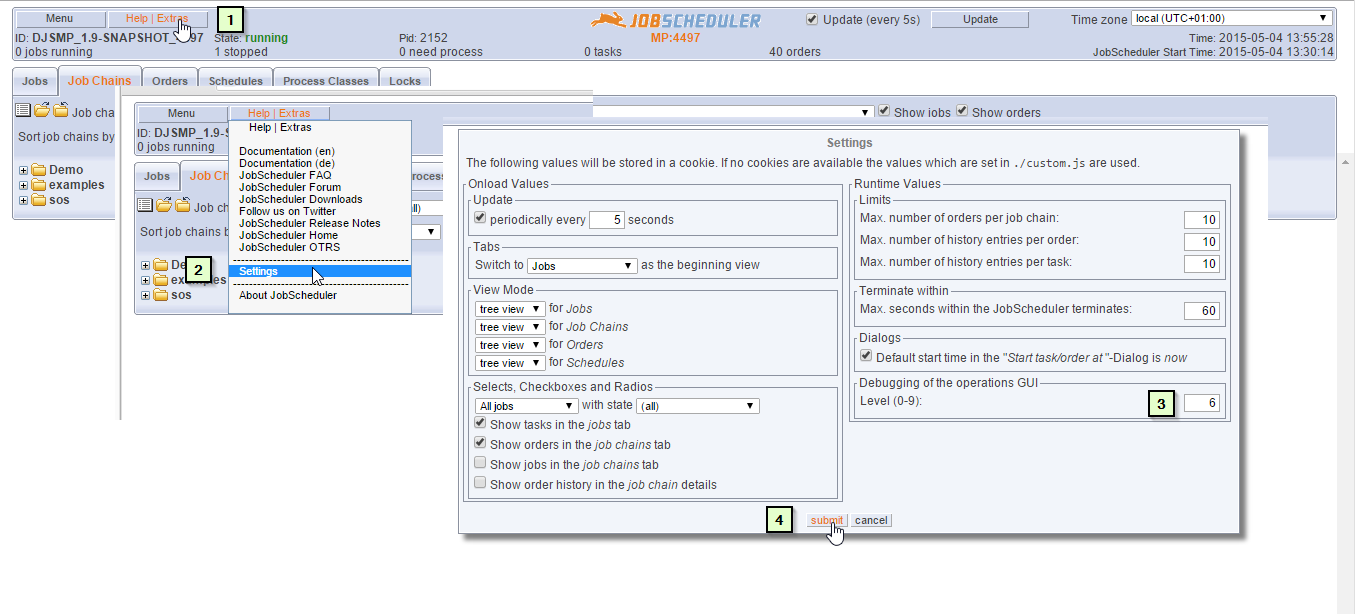
To enable the JOC debugging
- Click on Help | Extras ( Next to menu) button
- Click on Settings
- Change the value for "Debuggung of the operational GUI Level(0-9)" Set the value between 0-9
- Click on Submit
The JOC will open a new tab to display the debug information. You will see debug information in new tab depending upon Log Level, Number of job, job chain etc. and JOC update frequency.
Disable Debugging
To disable the JOC debugging follow the same steps as for Enable Debugging and in step three set the Log Level to 0.
Analyze Data In Debug Log
From the JOC debug message one can see the time taken by JobScheduler engine to prepare the information packet and also time taken to update JOC GUI etc. By analyzing time taken by different operation request --> response --> rendering you can find out what is causing JOC performance degradation.
JOC Performance improvement suggestions
- Organizing JobScheduler objects e.g. job, job chain under directories and sub directories.
- In case of higher number of JobScheduler objects JOC's tree view render faster compare to list view.
- Using JobScheduler with Jetty Web server rather then JobScheduler's inbuilt Web Server also has visible performance improvement.
- By increasing auto refresh / Update time to 30-45 seconds also reduce load on the JobScheduler engine.
- Also check your JobScheduler database for old indexes and other usual database related performance problems

