JobScheduler's memory and CPU usage depends on a number of factors:
- The number of jobs defined and the number of orders which have a schedule (aka run-time).
- The type of job. Internal API jobs consume more resources than pure shell-jobs but if a shell job uses pre or post-processing, it will consume a similar amount of resources as an internal API-job. The file-transfer jobs, which come with JITL (JobScheduler Integrated Template Library), are internal API Jobs.
- Whether a job is remotely or locally executed. All remotely executed jobs, e.g. executed by an agent or another instance of JS on a remote node, are like API-jobs.
- The number of tasks running in parallel.
Note that JS uses a special "order processing" concept. Order processing can reduce the workload that the JobScheduler on a machine well as the number of tasks running. An order is nothing else than a container for the parameters which are needed to execute a job or a job chain. A JobScheduler task can be processed in more than one order without terminating and being restarted.
Note also that using orders can reduce the number of jobs because it is possible to create generic jobs. An order has a schedule like a job and can also be executed on a JobScheduler cluster.
It is also possible to improve performance by limiting the number of jobs and tasks which are running on a node at a given time. One approach to doing this is to define a process classes for JobScheduler. For example, if you define a process class named "abc" and set the number of concurrent tasks to 10, JobScheduler will start no more than 10 tasks for the jobs being executed, even if there are more jobs waiting to be scheduled.
Here are three sketches that may illustrate how many factors come together to influence performance:
- We did some tests with tasks running in parallel on one of our systems. We started off by running 500 shell jobs in parallel. Our test system had no problem with up to 1500 jobs in parallel. But if we started more than 1500 then the JOC (JS Operations Center) started to slow down.
- A customer in the USA has approx. 1500 jobs defined, each of them with a schedule. These jobs are running more or less around the clock on a RedHat Linux with an Oracle 11 database. The CPU allocation for a single processor is nearly 50%. Note that the current version of JobScheduler is not able to use more than one CPU, even if more than one is available.
- A third example: a customer drives a series of Indesign servers with JS. More than 1000 orders are started and run for a short time – typically a few seconds, The orders use the same task sequentially without creating a setup time for each order. Here, JS is running on a Windows server and the workload it generates is relatively small.
One further point which has an impact on the performance of JS is the size of the history-database and the performance of the database server. We recommend that the database is compacted from time to time, e.g. once a week or perhaps once a day, depending on the number of job runs.
Tests with a Java API Job which processed 100, 150 and 200 orders in parallel
Tests are made on a CentOS 6.2 with 4CPUs (Intel(R) Xeon(R) CPU E3-1230 V2 @ 3.30GHz) and 9.7GB memory.
A JobScheduler 1.7.4177 (64Bit) is used.
Requirements
- Configure the job with java_optionh1. "-Xmx32m" to avoid the error
# There is insufficient memory for the Java Runtime Environment to continue.
- Edit the ~/.profile file of the JobScheduler user
ulimit -u 4096
and edit /etc/security/limits.conf
 [JobScheduler user] soft nofile 4096
 [JobScheduler user] hard nofile 10240
to avoid th error
java.lang.OutOfMemoryError: unable to create new native thread
Analysis
- Memory without running JobScheduler job
              total       used       free     shared    buffers     cached
 Mem:      10122748    1576536    8546212          0      38836     695908
 -/+ buffers/cache:     841792    9280956
 Swap:      2064376          0    2064376
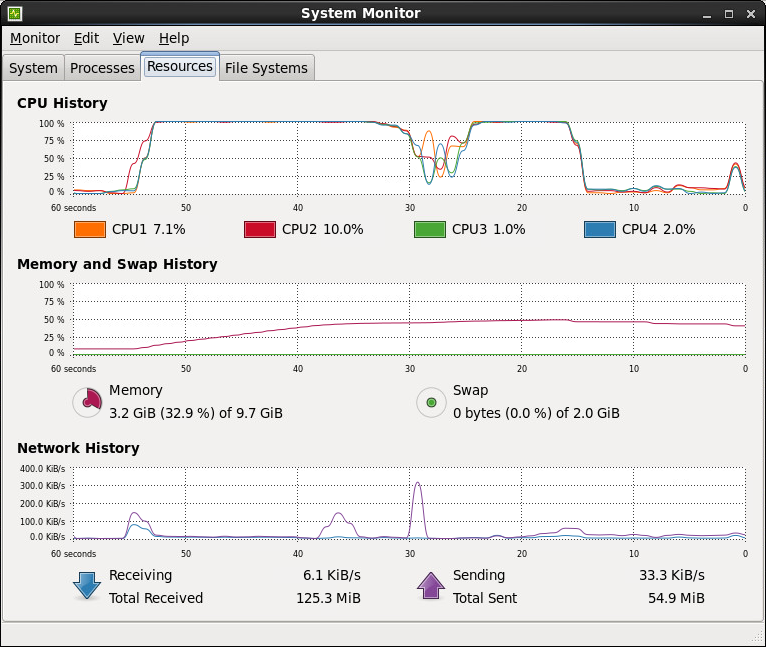
*Test: {*}100{*} orders in 100 tasks in parallel
              total       used       free     shared    buffers     cached
 Mem:      10122748    3389660    6733088          0      38852     699960
 -/+ buffers/cache:    2650848    7471900
 Swap:      2064376          0    2064376
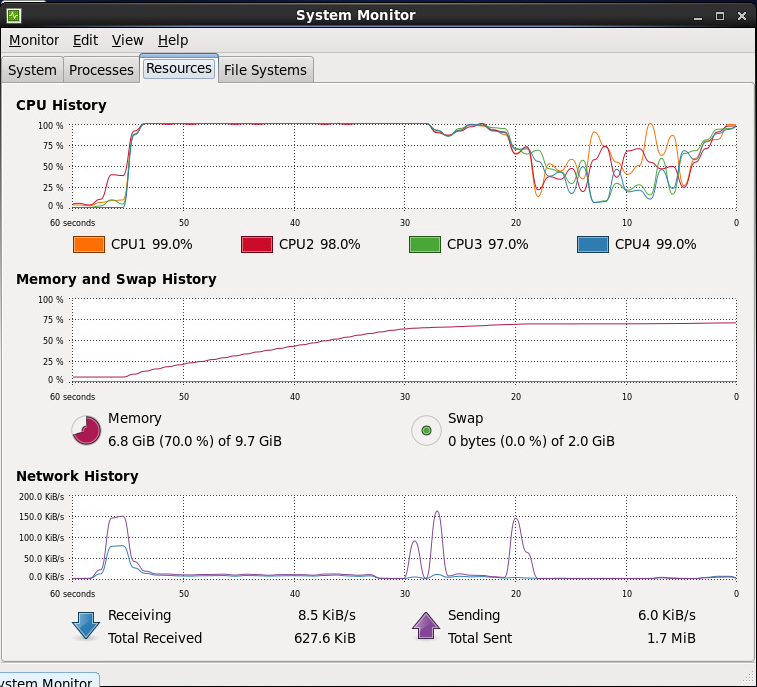
*Test: {*}150{*} orders in 150 tasks in parallel
              total       used       free     shared    buffers     cached
 Mem:      10122748    7219820    2902928          0      27276     251860
 -/+ buffers/cache:    6940684    3182064
 Swap:      2064376          0    2064376
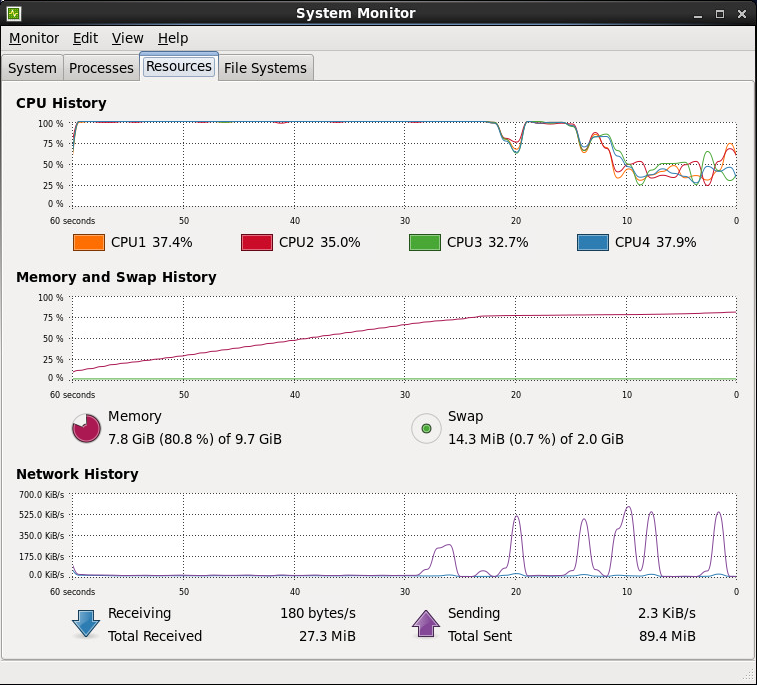
*Test: {*}200{*} orders in 200 tasks in parallel
              total       used       free     shared    buffers     cached
 Mem:      10122748    9989012     133736          0      12600     245496
 -/+ buffers/cache:    9730916     391832
 Swap:      2064376      14032    2050344