Introduction
- The Dashboard provides an overview of the JS7 system status:
- Cluster Status
- Controller Status
- Agent Status and Running Jobs
- The Dashboard also provides summary information about:
- Order State
- History Status
- Daily Plan State
- Inventory
Dashboard at a Glance

Summary Information
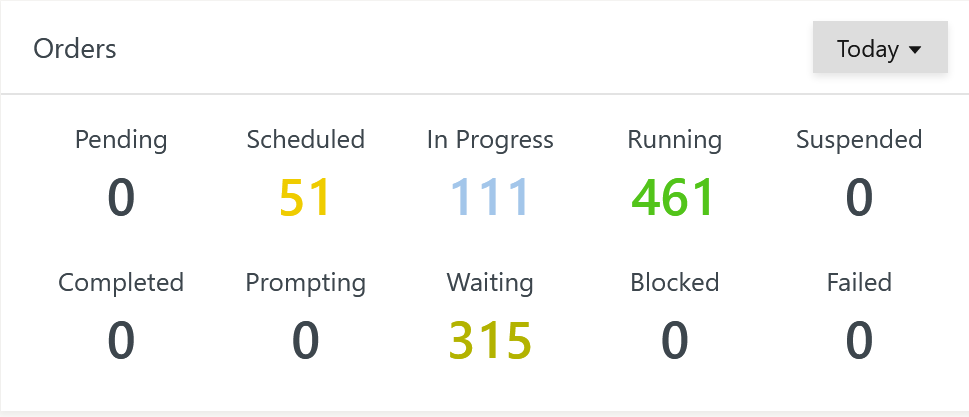
Orders
This widget displays the number of orders per state.
- Information about order states is provided in the JS7 - Order State Transitions article.
- Detailed information about this widget is provided in the JS7 - Orders article.
- The Order Summary is displayed
- for scheduled orders in the selected date range (today, next hour etc.),
- for other order states independent from the date range.
- Users can click the numbers displayed to find details in the Orders View.
History
This widget displays the number of completed orders and tasks for the Successful and Failed end states.
- Detailed History information is available in the JS7 - Order History View and the JS7 - Task History View.
- The History Summary is displayed for a selected date range (today, last hour, etc.).
- Users can click the numbers displayed to find details in the relevant History View.

Daily Plan
This widget displays the percentage of orders in the daily plan which have a particular state.
- Detailed information can be found in the JS7 - Daily Plan View.
- The Daily Plan summary is displayed for the selected date range (today, next day).
- Users can click the relevant part of the bar to find detailed information in the Daily Plan View.

Inventory
This widget displays the number of deployed Workflows & Jobs, Locks for mutual exclusion and Schedules.
- Detailed information about inventory objects is presented in the JS7 - Inventory View.

System Status
Cluster Status
This widget provides an overview of the products in a JS7 scheduling environment, and their operational and connection status.
- Connection Status
- JOC Cockpit instances are connected:
- to a Database,
- to Controller instances, e.g. to a Standalone Controller or to a Controller Cluster with a Primary and Secondary Controller instance.
- Controller instances in a cluster are connected to each other.
- The connection status, i.e. the lines between products, are displayed with the following colors:
- The connected status indicates a working connection.
- The unstable status indicates that the connection works but has had errors during the last 30 minutes.
- The unknown status indicates that the connection could not be established. This does not mean that the product is not running as e.g. network issues can prevent a connection from being established.
- JOC Cockpit instances are connected:
- Component Status
- The component status is indicated by the colored square in the left upper corner of each product.
- The green component status signals availability, the red square signals an unknown component status as the product is not connected.
- Cluster Node State
- The cluster node state is displayed for:
- a number of JOC Cockpit instances running in parallel.
- a Primary Controller instance and Secondary Controller instance in a Controller cluster.
- JOC Cockpit
- JOC Cockpit can be implemented as an active-passive cluster with any number of instances.
- The active JOC Cockpit instance displays the active cluster node state.
- Additional JOC Cockpit instances display a standby or unknown cluster node state.
- The JOC Cockpit instance currently being used is displayed with a thick border and offers a context menu with items:
- to restart the JOC Cockpit cluster,
- to restart individual JS7 - Services,
- to download the JOC Cockpit main log file, see JS7 - Log Files and Locations.
- Standby JOC Cockpit instances offer a switch-over function in their context menu that causes the standby instance to become the active instance in a cluster. Switch-over typically is performed within 60s as this is not considered an emergency fail-over but normal operation that leaves running background services enough time to complete their tasks.
- JOC Cockpit can be implemented as an active-passive cluster with any number of instances.
- Controller
- A Controller can be implemented as an active-passive cluster with two instances.
- Cluster Node State
- The active Controller instance and the standby Controller instance cluster node states are displayed. Controller instances with an unknown component status are not connected to a JOC Cockpit instance and their cluster node state cannot be determined.
- Cluster Status
- The Coupled cluster status indicates a working cluster with Controller instances being synchronized.
- The ClusterNodesAppointed and PreparedToBeCoupled cluster status indicate that the cluster currently is connecting and is synchronizing past events. This occurs after a restart of one or both Controller instances. This is a temporary status until the synchronization has been completed.
- The PassiveLost cluster status indicates that the standby Controller instance is not connected to the active Controller instance. The active Controller instance will continue to execute workflows and jobs, however, this cluster status indicates loss of high-availability.
- The cluster node state is displayed for:
Agent Status
This widget displays a pie chart showing the connection status of Agents:
- Agents in a Coupled state are connected to a Controller and can run jobs.
- Agents in a Coupling state are prepared for connection by a Controller.
- Agents in a Coupling Failed state are not connected and cannot run jobs.
Clicking the respective section of the pie chart navigates to the Resources -> Agents View to display details about individual Agents.

Agent Running Jobs
This widget displays the number of tasks, i.e. jobs, running for each Agent.
- The widget displays Agents in the order of frequency of parallel jobs. The length of the bar indicates the number of jobs running in parallel.
- Users can modify the widget size to display, for example, the 30 Agents with the highest number of parallel jobs.

Controller Status
This widget displays the status of the Controllers connected to JOC Cockpit.
- A Controller can include one standalone instance or a primary & secondary instance in a cluster. Controller instances in a cluster share the same Controller ID.
- Any number of Controllers can be connected to JOC Cockpit. Users can switch between Controllers by clicking the indicated Controller ID. A list box for switching Controllers is also provided in the right upper corner of the JOC Cockpit screen.
- Note that the user profile can be configured for individual Controllers, i.e. you could use different themes for each Controller.

Dashboard Layout
The Dashboard View allows the layout to be modified using the Edit Layout and Reset Layout buttons.
This allows to selection/deselection of the widgets to be displayed, flexible positioning of the widgets displayed on the screen and changing the size of individual widgets.
Resetting the Dashboard layout will revert the display to the default layout as described above.
Overview
Content Tools