Introduction
- Instead of the tabular visualization in report files, users can add a more lively visual design to their Excel® reports by using the Import Excel Module (3rd-party).
- Reports start as usual with data in rows and columns, however, with a choice of colors, Pivot Tables, and Charts, designs can be developed that provide better visualization and better decision making.
Use Cases
The PowerShell Command Line Interface 2.0 is used by jobs to extract data and to create reports. Two modules are available for designing better reports:
- The JS7 - PowerShell Module,
- A reporting PowerShell Module. This example makes use of the ImportExcel PowerShell Module (3rd party) which can be used to create Excel® reports and to add Pivot Tables and Pivot Charts to reports. The module can be operated for Windows and Linux computers and does not require prior installation of Microsoft Excel®.
A sample report is available here: jobscheduler_task_history_designed_report.xlsx
- Note that the jobs below are examples which have to be adjusted to your environment.
- Download the workflow (upload .json): report_design_task_history_windows.workflow.json
Explanations:
- Line 1: The job is executed with a Windows Agent and makes use of the PowerShell shebang for Windows.
- Line 3-4: The required PowerShell modules are imported. They could be installed in any location in the file system.
- Line 6-7: The Connect-JS7 cmdlet is used to authenticate with the JS7 REST Web Service API. The required arguments for
-Url,-Credentialsand-Idcan be specified in a number of ways:- As described in the JS7 - How to connect to JOC Cockpit using the PowerShell Module article.
- Using JS7 - Job Resources that inject environment variables to the PowerShell job.
- Using a PowerShell profile.
- Line 10: The Get-JS7TaskHistory cmdlet is invoked:
- with the
-Timezoneparameter to specify the time zone which date values in the report should be converted to. The-Timezone (Get-Timezone)parameter value specifies that the time zone of the Agent's server is used. Otherwise specify the desired time zone, for example like this:-Timezone (Get-Timezone -Id 'GMT Standard Time'). Without using this parameter any date values are stored in the report as UTC dates. - optionally with additional parameters, for example, to specify the date or date range which the report is created for. A value
-RelativeDateTo -3dspecifies that the report should cover the last 3 days (until midnight). Keep in mind that dates have to be specified for the UTC time zone. Without this parameter the report will be created for the next day. - see the Get-JS7TaskHistory cmdlet for a full parameter reference.
- with the
- Line 11-20: From the output of the
Get-JS7TaskHistorycmdlet a number of properties are selected and are specified for the sequence in which they should occur in the report.- To add more appropriate column headers the property names are mapped to a more readable textual representation.
- Consider the handling of date formats in lines 16-20. The use of the
Get-Datecmdlet converts the output format of dates (not the time zone) to the default format which is in place on the Agent's server. Without using theGet-Datecmdlet, any date values will be stored in the report in ISO format, e.g.2020-12-31 10:11:12+02:00for a date in the European central time zone that is UTC+1 in winter time and UTC+2 in summer time. - Line 18 introduces a new property, a calculated duration. From the start time and end time values of a planned start the difference in seconds is calculated and is added to the report.
- Line 22: The location where the Excel file will be stored is specified with the
$xlsxFilevariable. - Line 24: Create a variable
$workSheetNamewhich is used to store the name of the worksheet. - Line 26-31: Creates a spreadsheet and passes on the Excel Package object which provides the reference to the workbook and turns to the worksheets inside it.
$xlsxFilestores the path of the Excel® file.- If you are updating an existing worksheet and the new data wouldn’t completely cover the area consumed by previous data, then you may be left with “ghost” data. To ensure this doesn’t happen, you can use the
-ClearSheetoption to remove previous data in a worksheet. -PassThrureturns the Pivot Table so it can be customized.-AutoSizeparameter allows you to resize the columns of the spreadsheet to fit the data added and to get the column-widths right.- For adding color to conditional text
-ConditionalTextis used. Additional types of conditional format are supported. Here conditional text is used for the job status color like (successful=green, incomplete=orange, failed=red). To assign a name to the worksheet the
-WorksheetNameparameter is used. The default name of the worksheet is sheet1.- The -
IncludePivotTableand -IncludePivotChartparameters generate the Pivot Table and Pivot Chart. The parameter -ChartTypelets you pick what type of chart you want to use, there are many examples to choose from: Area, Line, Pie, ColumnClustered, ColumnStacked100, ColumnClustered3D, ColumnStacked1003D, BarClustered, BarOfPie, Doughnut, etc. - The -
PivotRowsand-PivotDataparameters describe how to tabulate the data.
- Line 35: The
-PivotTableNameparameter is used as the name for the new Pivot Table. - Line 35: By default, a Pivot Table will be created in its own worksheet, but it can be created in an existing worksheet. In the above job example the
$excel.$WorkSheetName.cells["K1"]parameter defines the cell in an existing worksheet where the pivot table will be created. - Line 37:
$excel.$WorkSheetNamerefers to the worksheet in which the source data are found. - Line 38: The
-PivotRowsparameter is used for fields to set as rows in the Pivot Table. - Line 39: The
-PivotDataparameter contains a hash table in the form "FieldName"="Function," where a function is one of Average(), Count(), CountNums(), Max(), Min(), Product(), None(), StdDev(), StdDevP(), Sum(), Var(), VarP(). - Line 40: To apply a table style to the Pivot Table the
-PivotTableStyleparameter is used. The PivotTableStyle “Medium6” is the default table style but there are plenty of others to choose from. Example: PivotTableStyles = None, Custom, Light1 to Light21, Medium1 to Medium28, Dark1 to Dark11. - Line 48: The Disconnect-JS7 cmdlet is used to close the connection to JOC Cockpit.
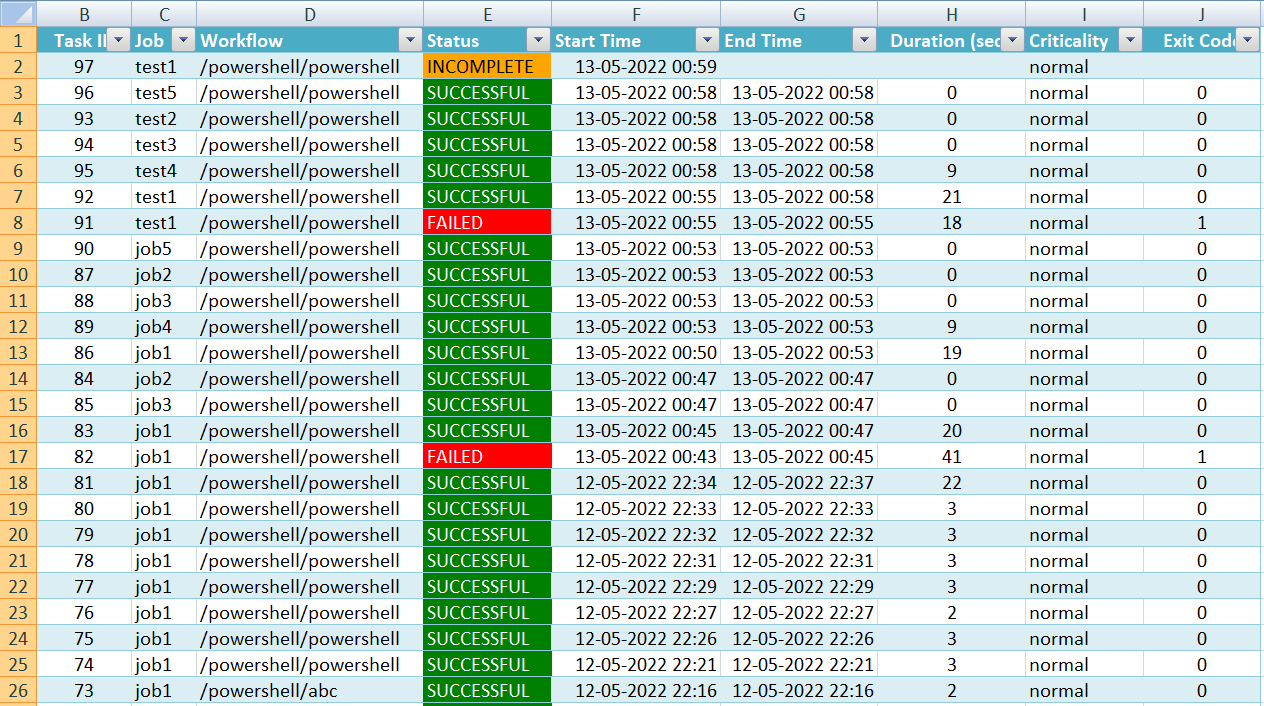
Sample Report Sheet with colored status:
The screenshot below contains the output of the Get-JS7TaskHistory cmdlet stored in the Excel report sheet. Users can change the colors of text and background of cells according to their choice.
The example below presents the status of jobs with different colors using the
-ConditionalTextparameter of the ImportExcel module.
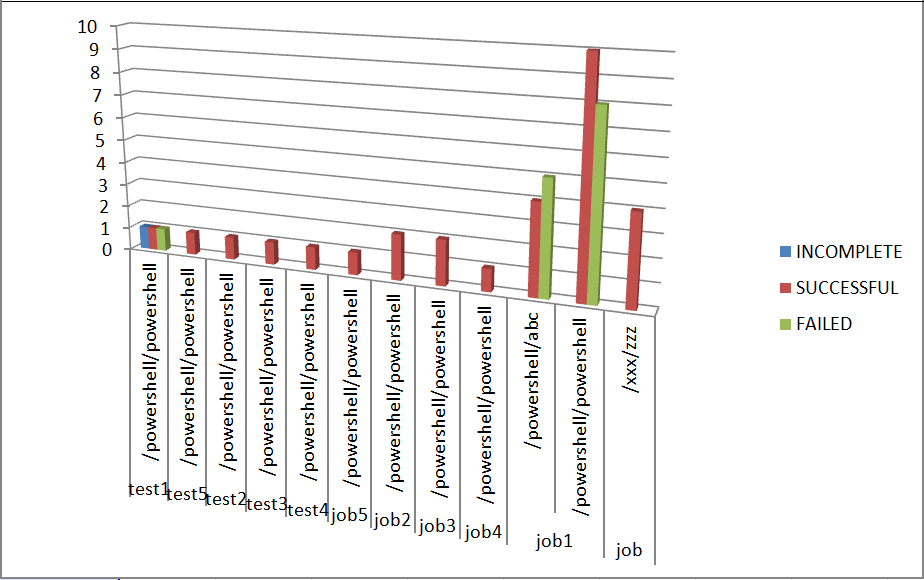
Sample Charts:
- There is a sample Pivot Chart created with the parameter
-ChartType ColumnClustered3D. - This chart type is used in this example to display the number of jobs per state (successful, incomplete, failed) of jobs.
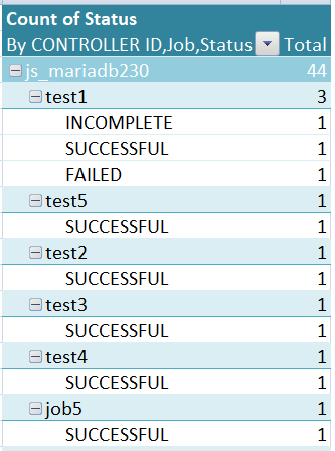
Sample Pivot Table:
- The sample Pivot Table displays the RowHeaderCaption as "By JobScheduler ID, Job, Status". Users can adjust the style of the table by using the
-PivotTableStyleparameter. - Users can expand and collapse the Pivot Table.
Overview
Content Tools