Introduction
- The Monitor view includes a number of sub-views to provide information about the JS7 availability and notifications about job errors and warnings:
- Controller Availability: display up times and downtimes of a Controller
- Agent Availability: display up times and downtimes of Agents connected to a Controller
- Notifications: display job warnings and job errors
Controller Availability
This view displays the availability (up time, down time) of a Controller for an adjustable range of time:
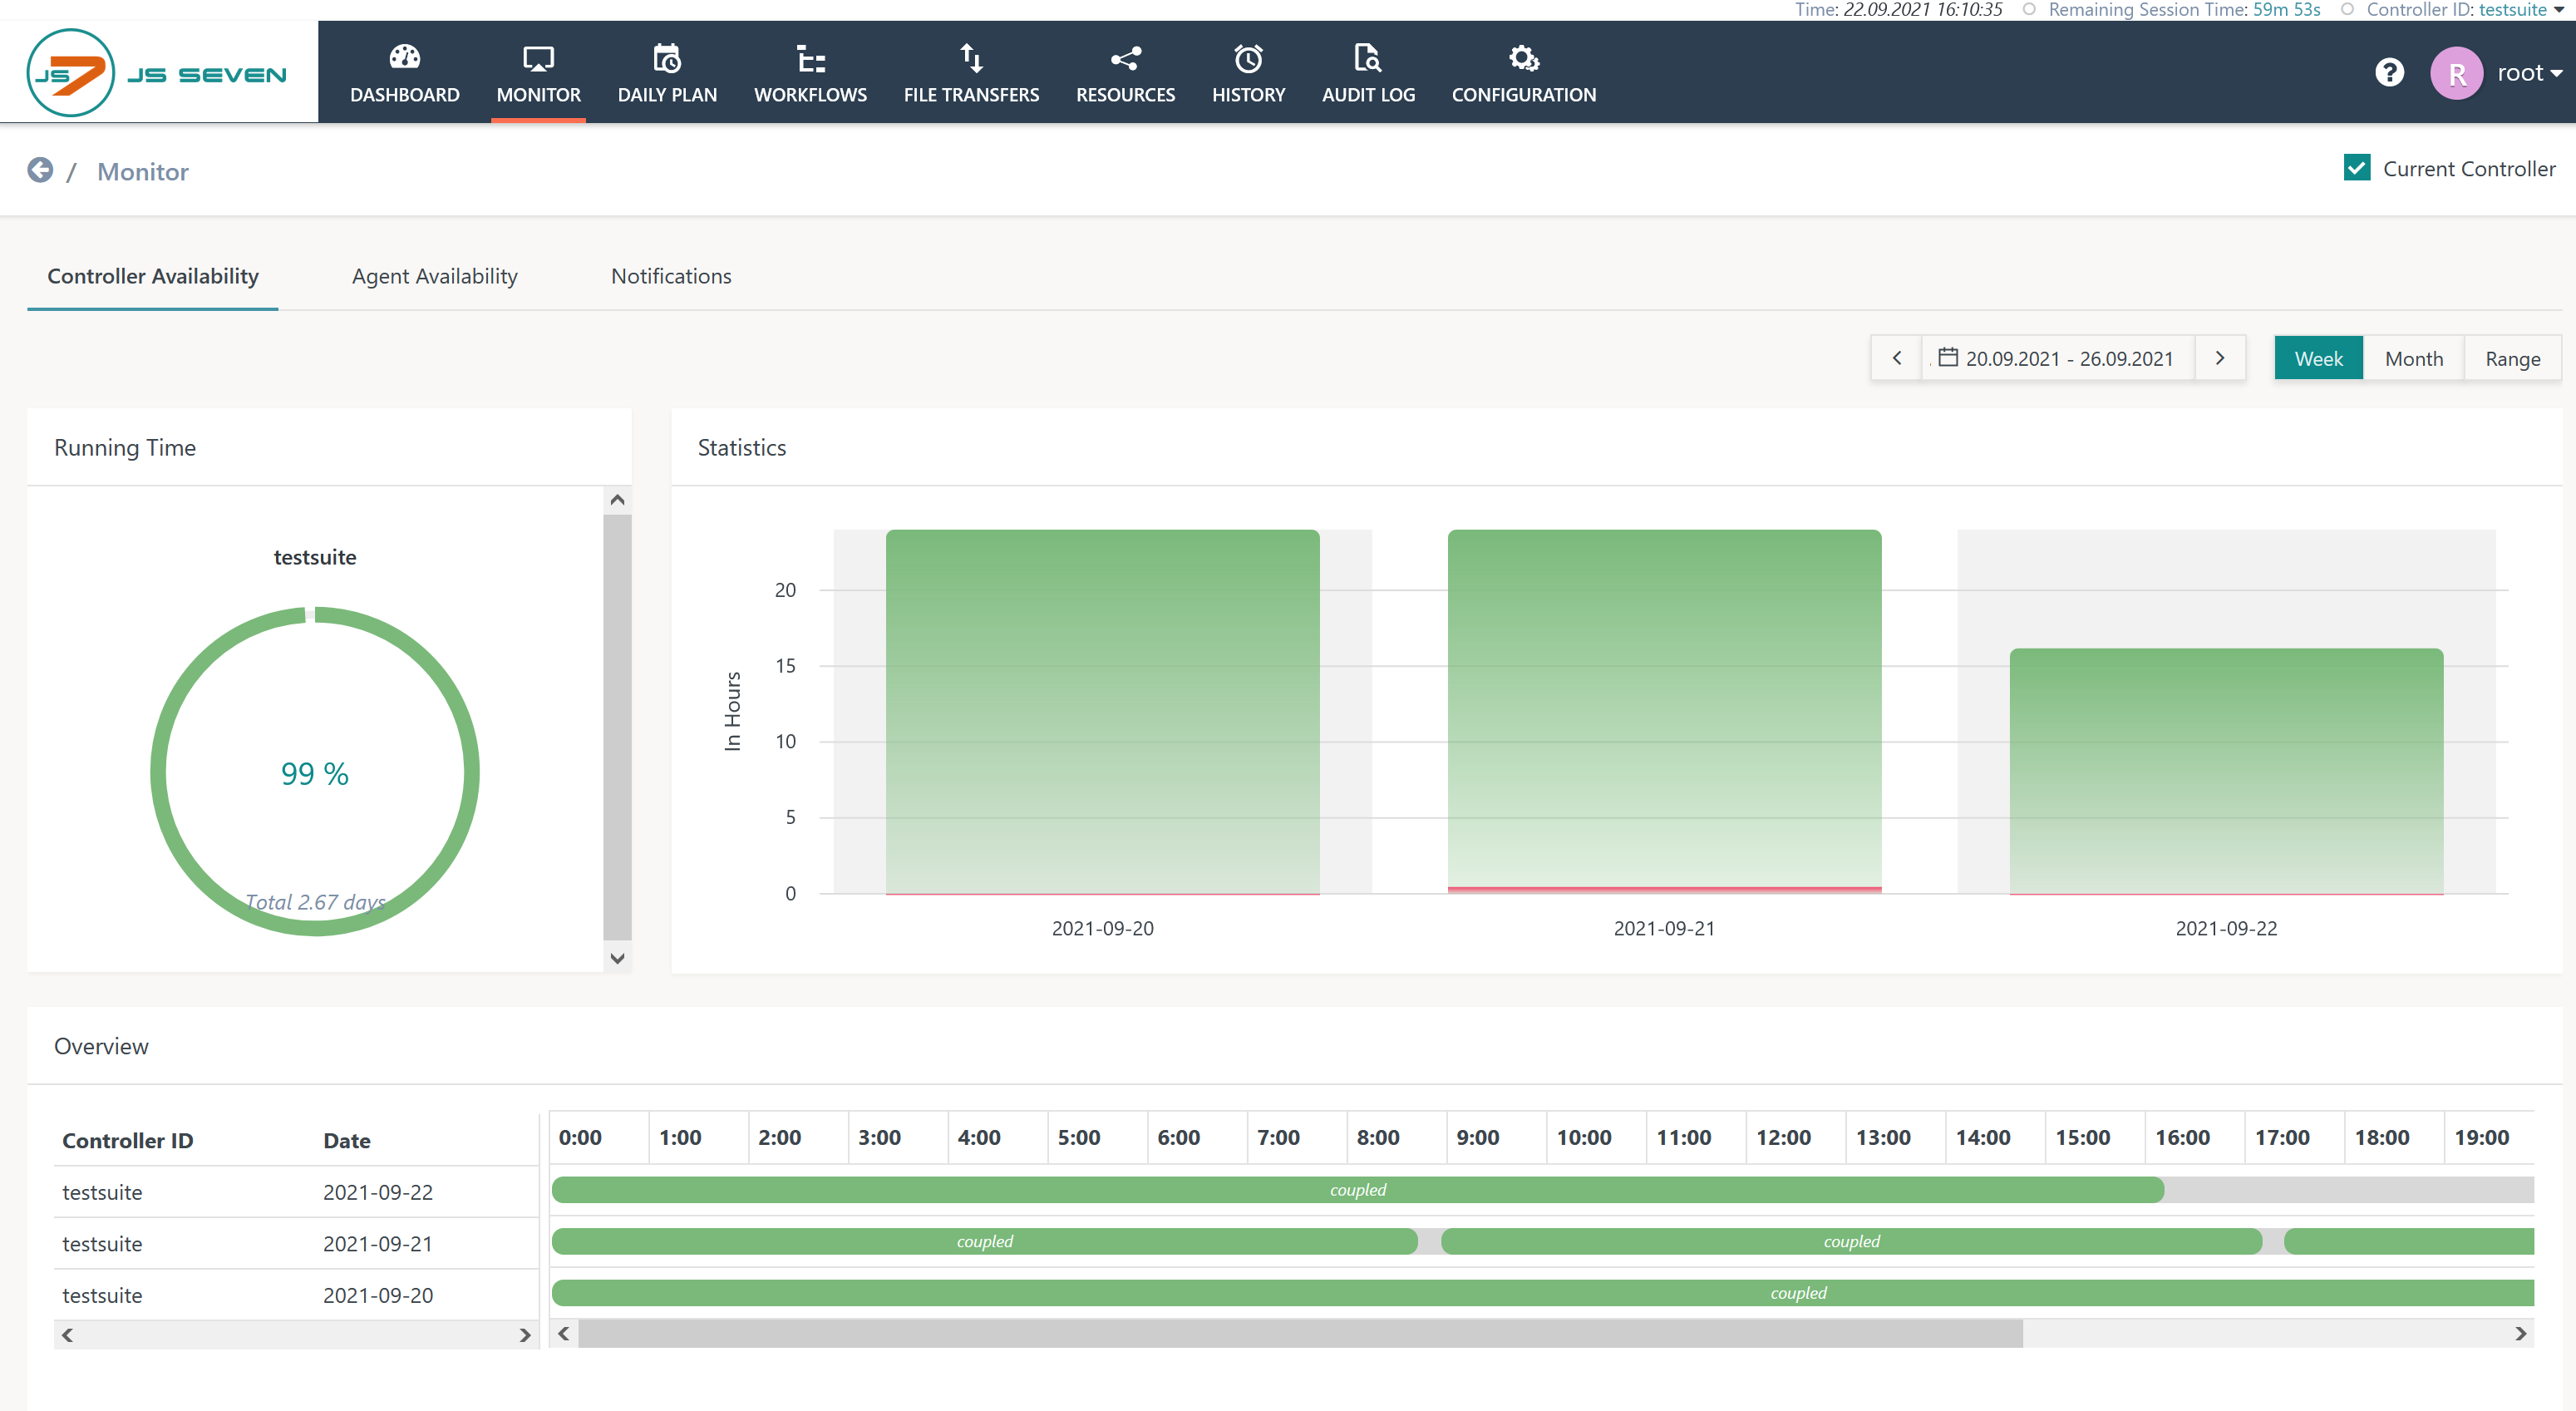
Explanation:
- Consider that a Controller can be operated as a standalone instance or as a cluster with a primary and secondary instance. For a cluster availability is reported using both Controller instances.
- Running Time: this block summarizes the availability in percent of the selected time range.
- Statistics: the bar chart shows the number of hours per day in green color for up times and in red color for down times.
- Overview: this block displays hours per day for up times and down times.
- Date Range: the date range can be selected per week, month or by specifying an individual range.
Agent Availability
This view displays the availability (up time, down time) of Agents for an adjustable range of time:
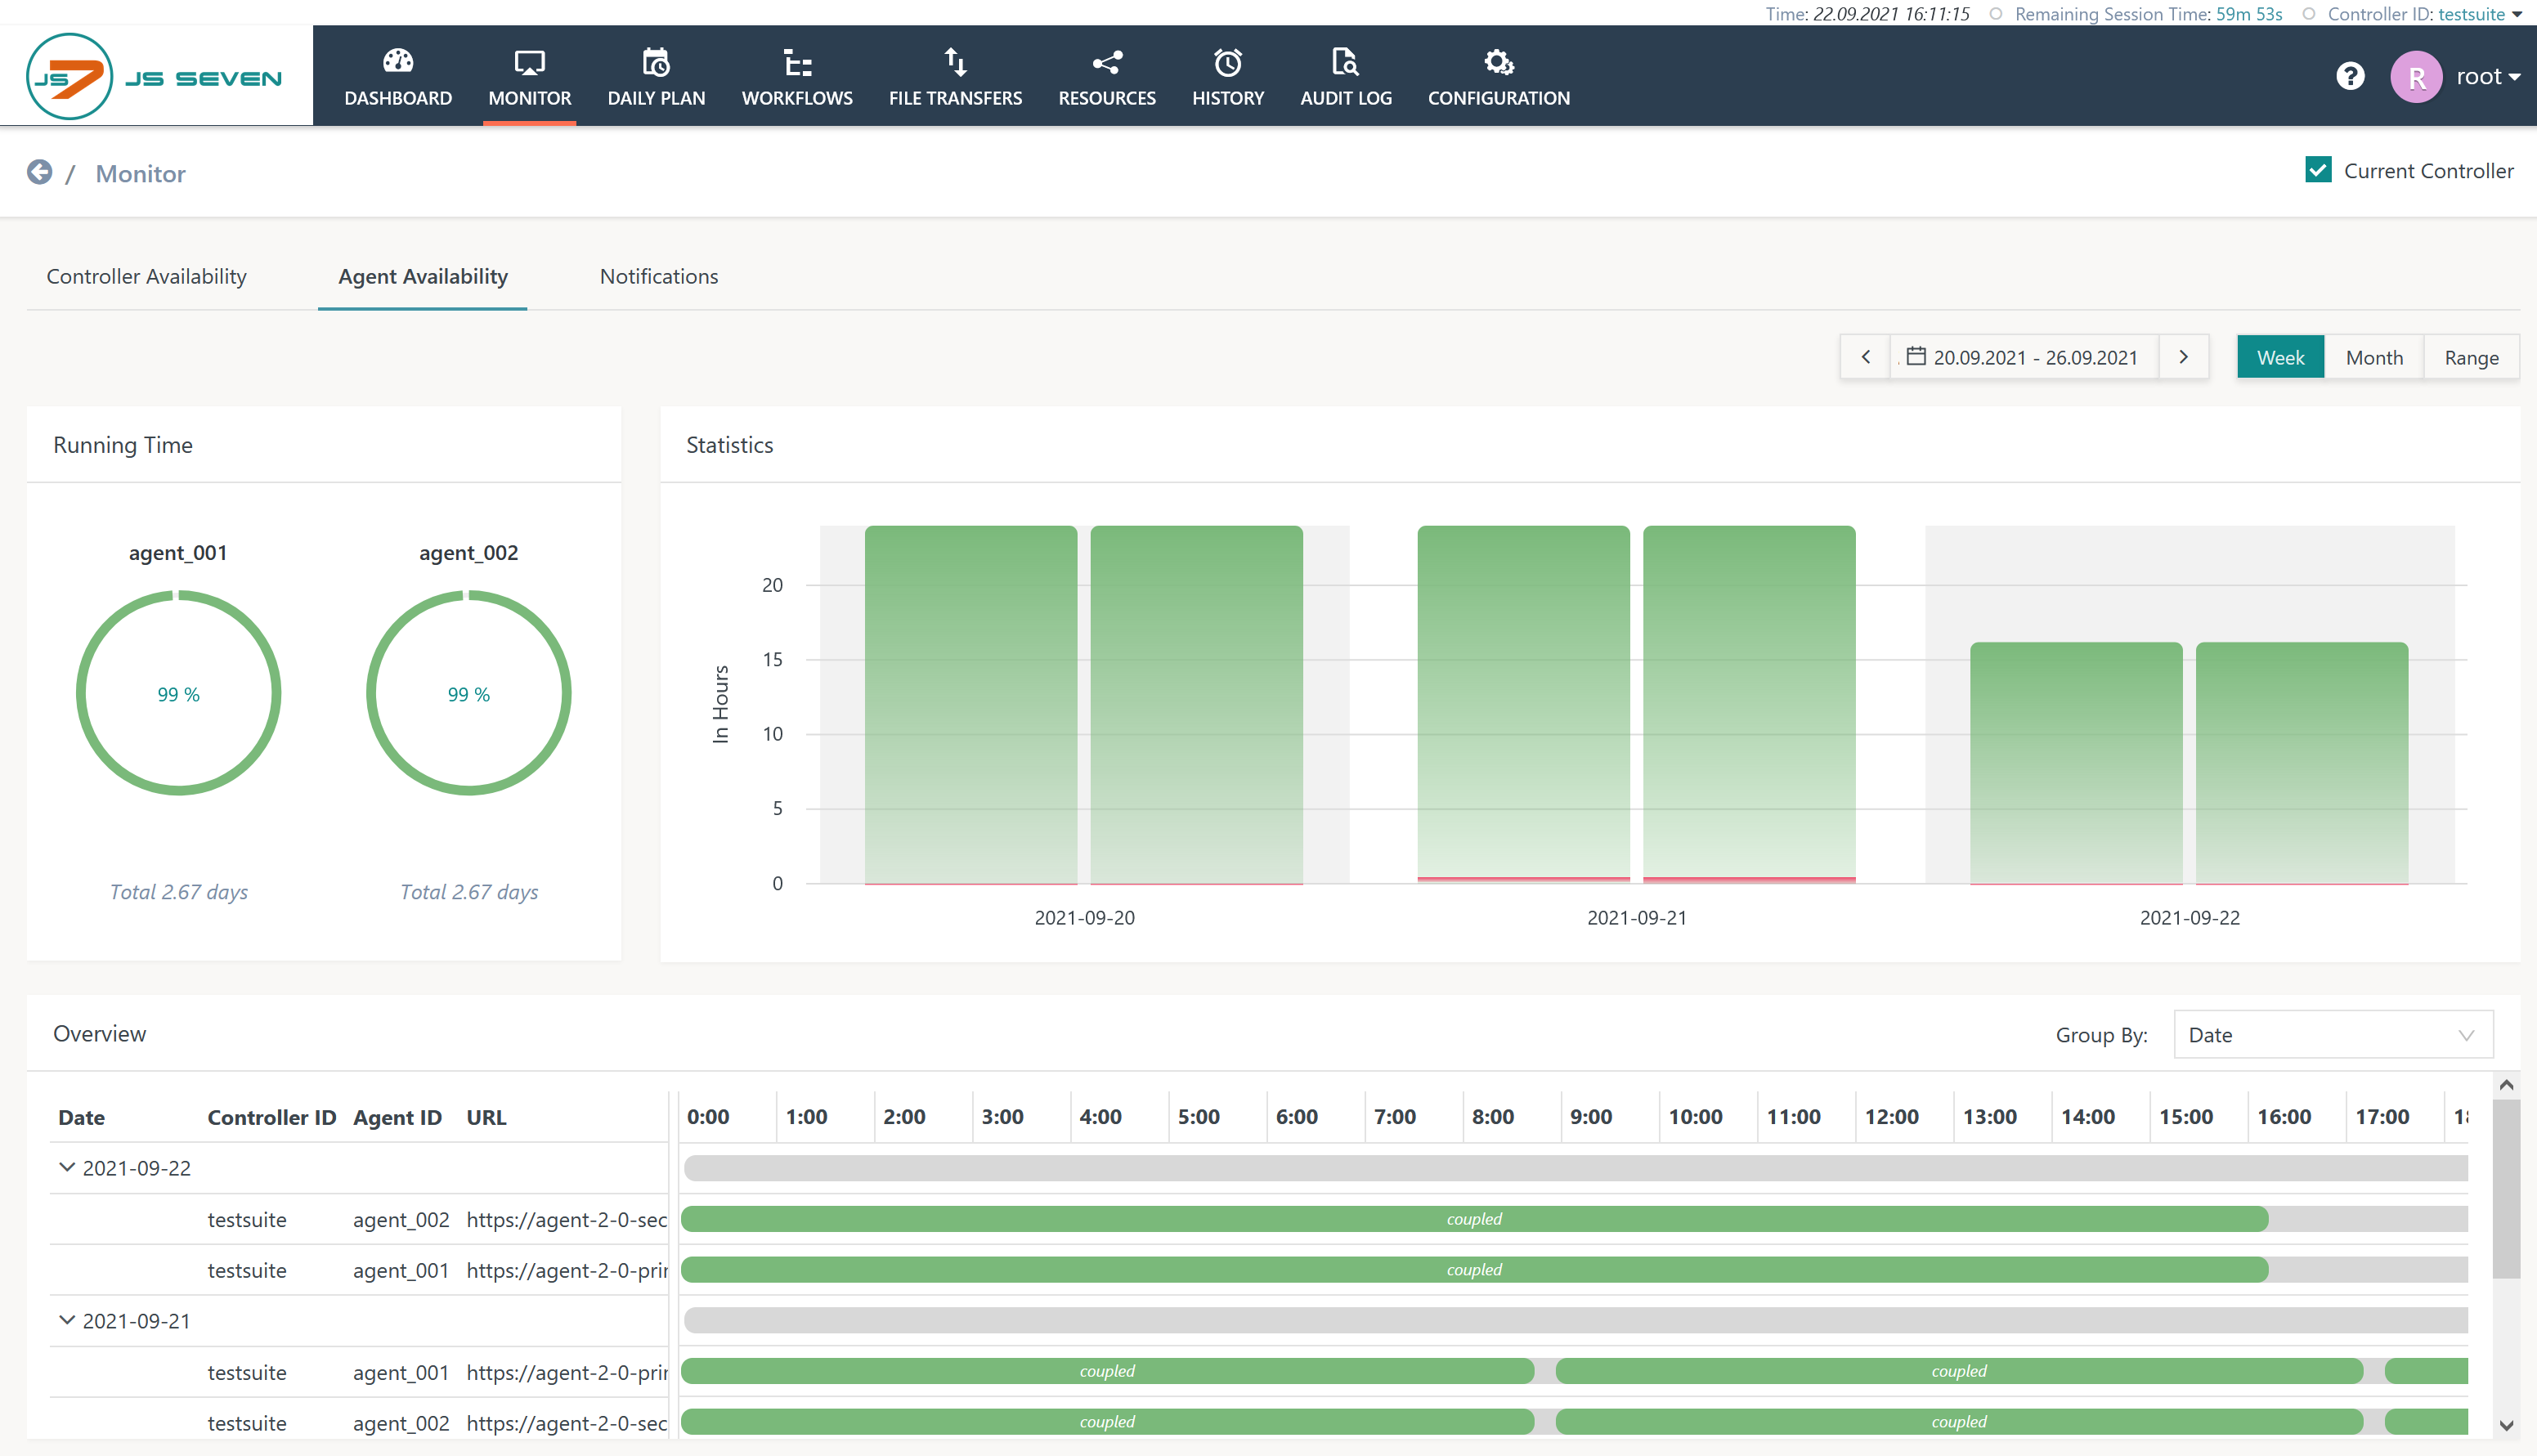
Explanations:
- Running Time: this block summarizes the availability in percent of the selected time range.
- Statistics: the bar chart shows the number of hours per day in green color for up times and in red color for down times.
- Overview: this block displays hours per day for up times and down times.
- Date Range: the date range can be selected per week, month or by specifying an individual range.
Notifications
Overview
Content Tools