Page History
...
- The Monitor view includes a number of sub-views to provide information about JS7 availability and notifications about job errors and warnings:
- Controller Availability: display up times and downtimes down times of a Controller
- Agent Availability: display up times and downtimes down times of Agents connected to a Controller
- Notifications: display job warnings and job errors
...
This view displays the availability (up time, down time) of a Controller for an adjustable range of time:
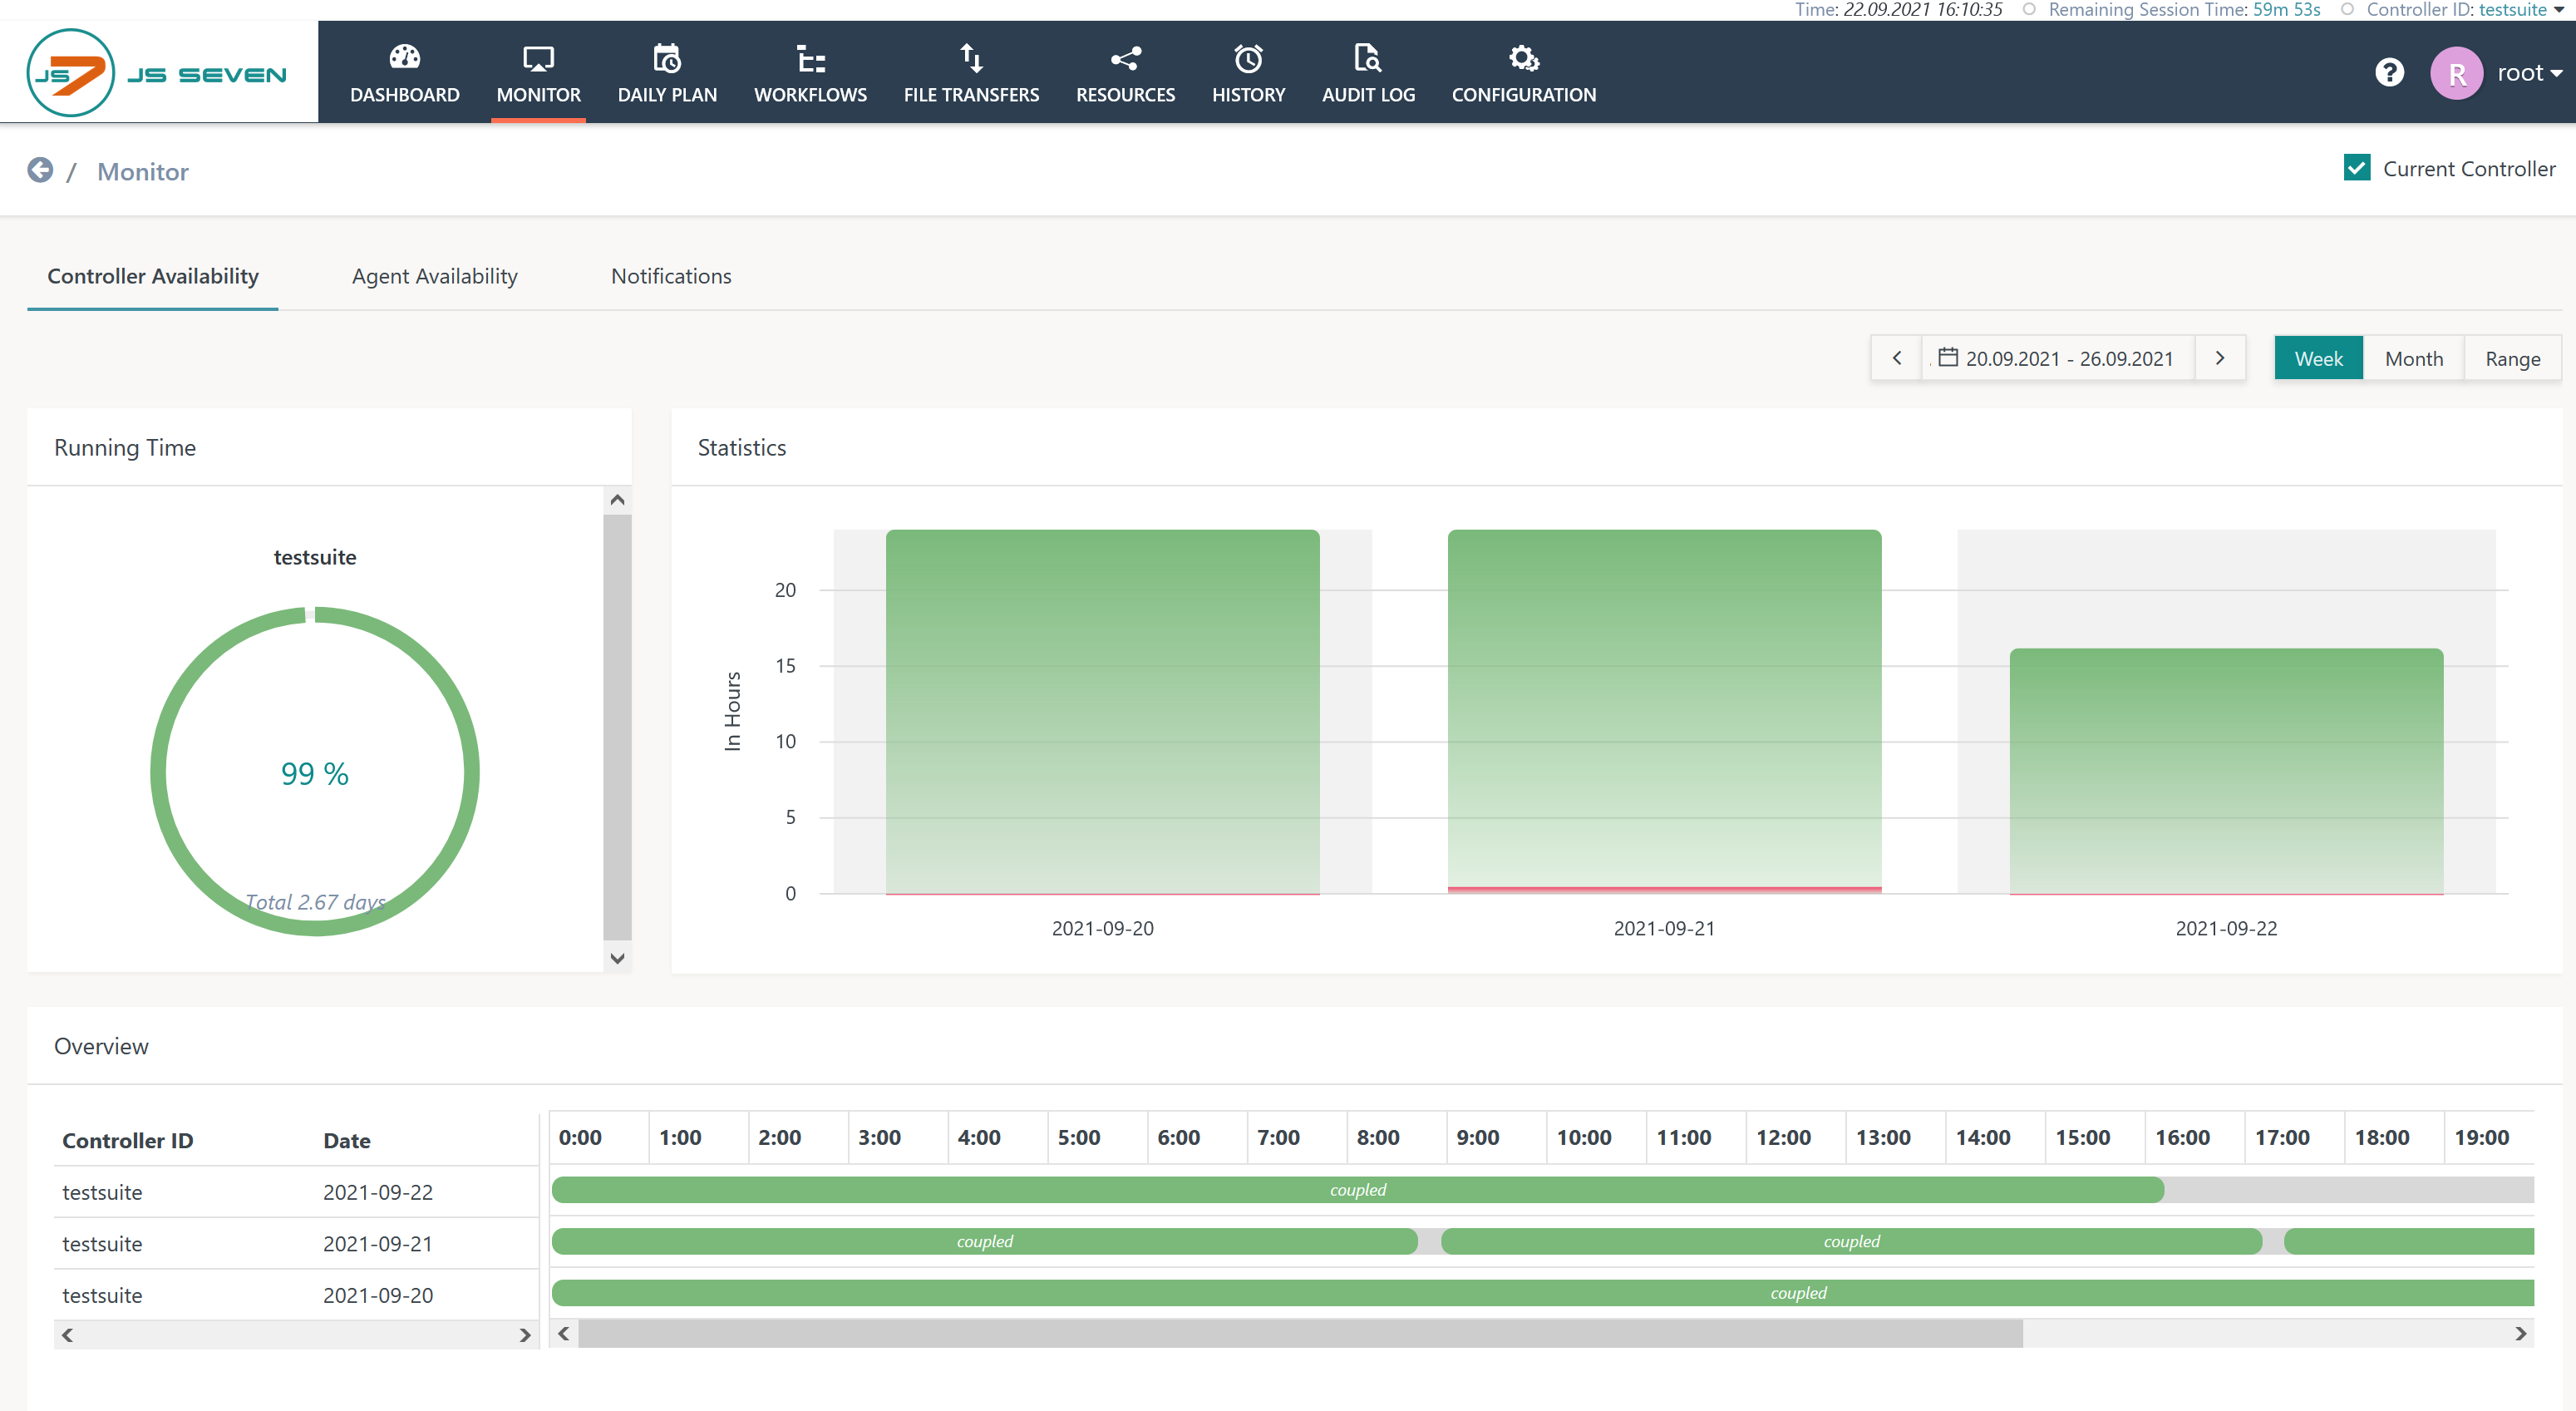
Explanation:
- Consider Note that a Controller can be operated as a standalone instance or as a cluster with a primary and secondary instance. For a Controller cluster availability is reported using for both Controller instances.
- The checkbox Current Controller checkbox limits the results displayed to the currently selected Controller, otherwise results are displayed for any all connected Controllers.
- Running Time: this block summarizes the availability in percent of the selected time range.
- Statistics: the bar chart shows the number of hours per day in green color for the up times and in red color for the down times.
- Overview: this block displays hours per day for up times and down times.
- Date Range: the date range can be selected per week, month or by specifying an individual range.
...
This view displays the availability (up time, down time) of Agents for an adjustable range of time:
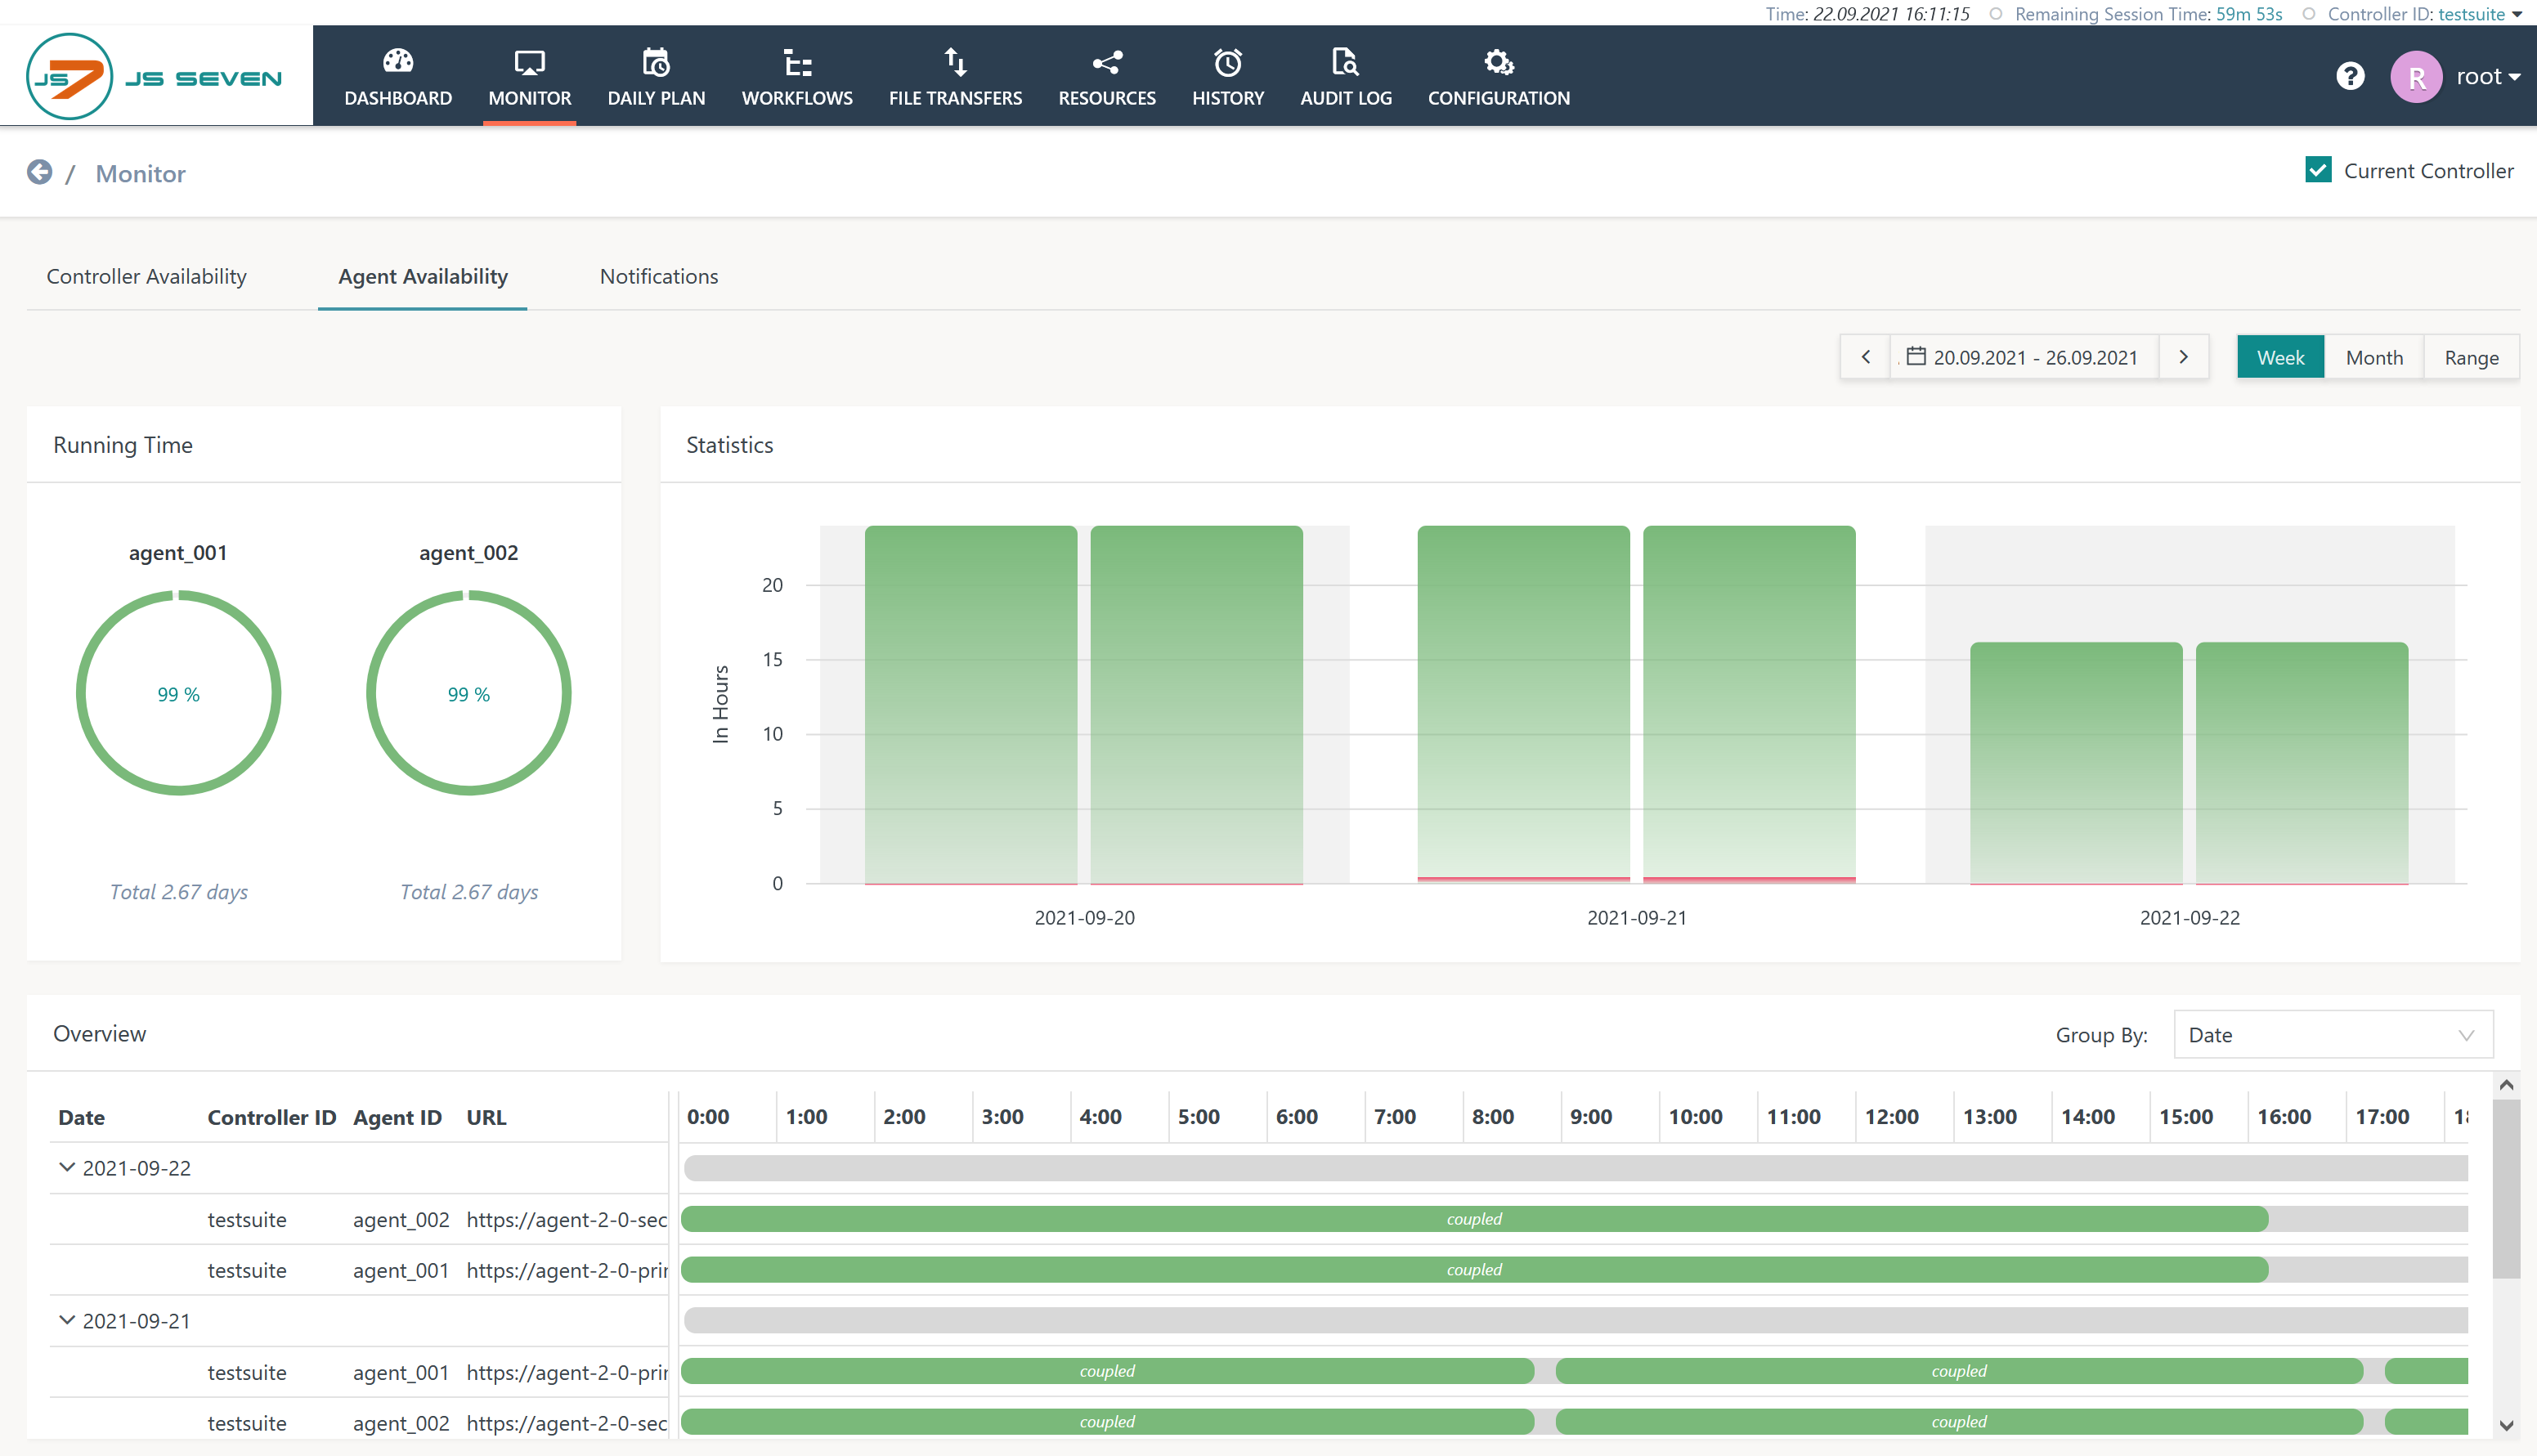
Explanation:
- The checkbox Current Controller checkbox limits the results displayed to Agents registered with the currently selected Controller, otherwise results are displayed for Agents registered with any all connected Controllers.
- Running Time: this block summarizes the availability in percent of the selected time range.
- Statistics: the bar chart shows the number of hours per day in green color for up times and in red color for down times.
- Overview: this block displays hours per day for up times and down times.
- Date Range: the date range can be selected per week, month or by specifying an individual range.
...
Notifications are created for job warnings and errors:
- Warnings include to indicate indicating if a job was running shorter or longer than expected.
- The JS7 - Job Instruction allows to set the threshold values for minimum and maximum expected duration to be set.
- A warning does not impact execution of a job.
- Errors indicate job problems. The can be handled:
- automatically from a workflow, e.g. by use of the JS7 - Try / Catch Instruction,
- manually by a user who can resume and skip execution of jobs in a workflow.
- Notifications are configured from the Configuration view, see JS7 - Notification.
- The Notification view updates automatically if new warnings or errors are raised. It can therefore be used to continuously monitor job problems.
The Notification view looks like thisis shown in the following screenshot:
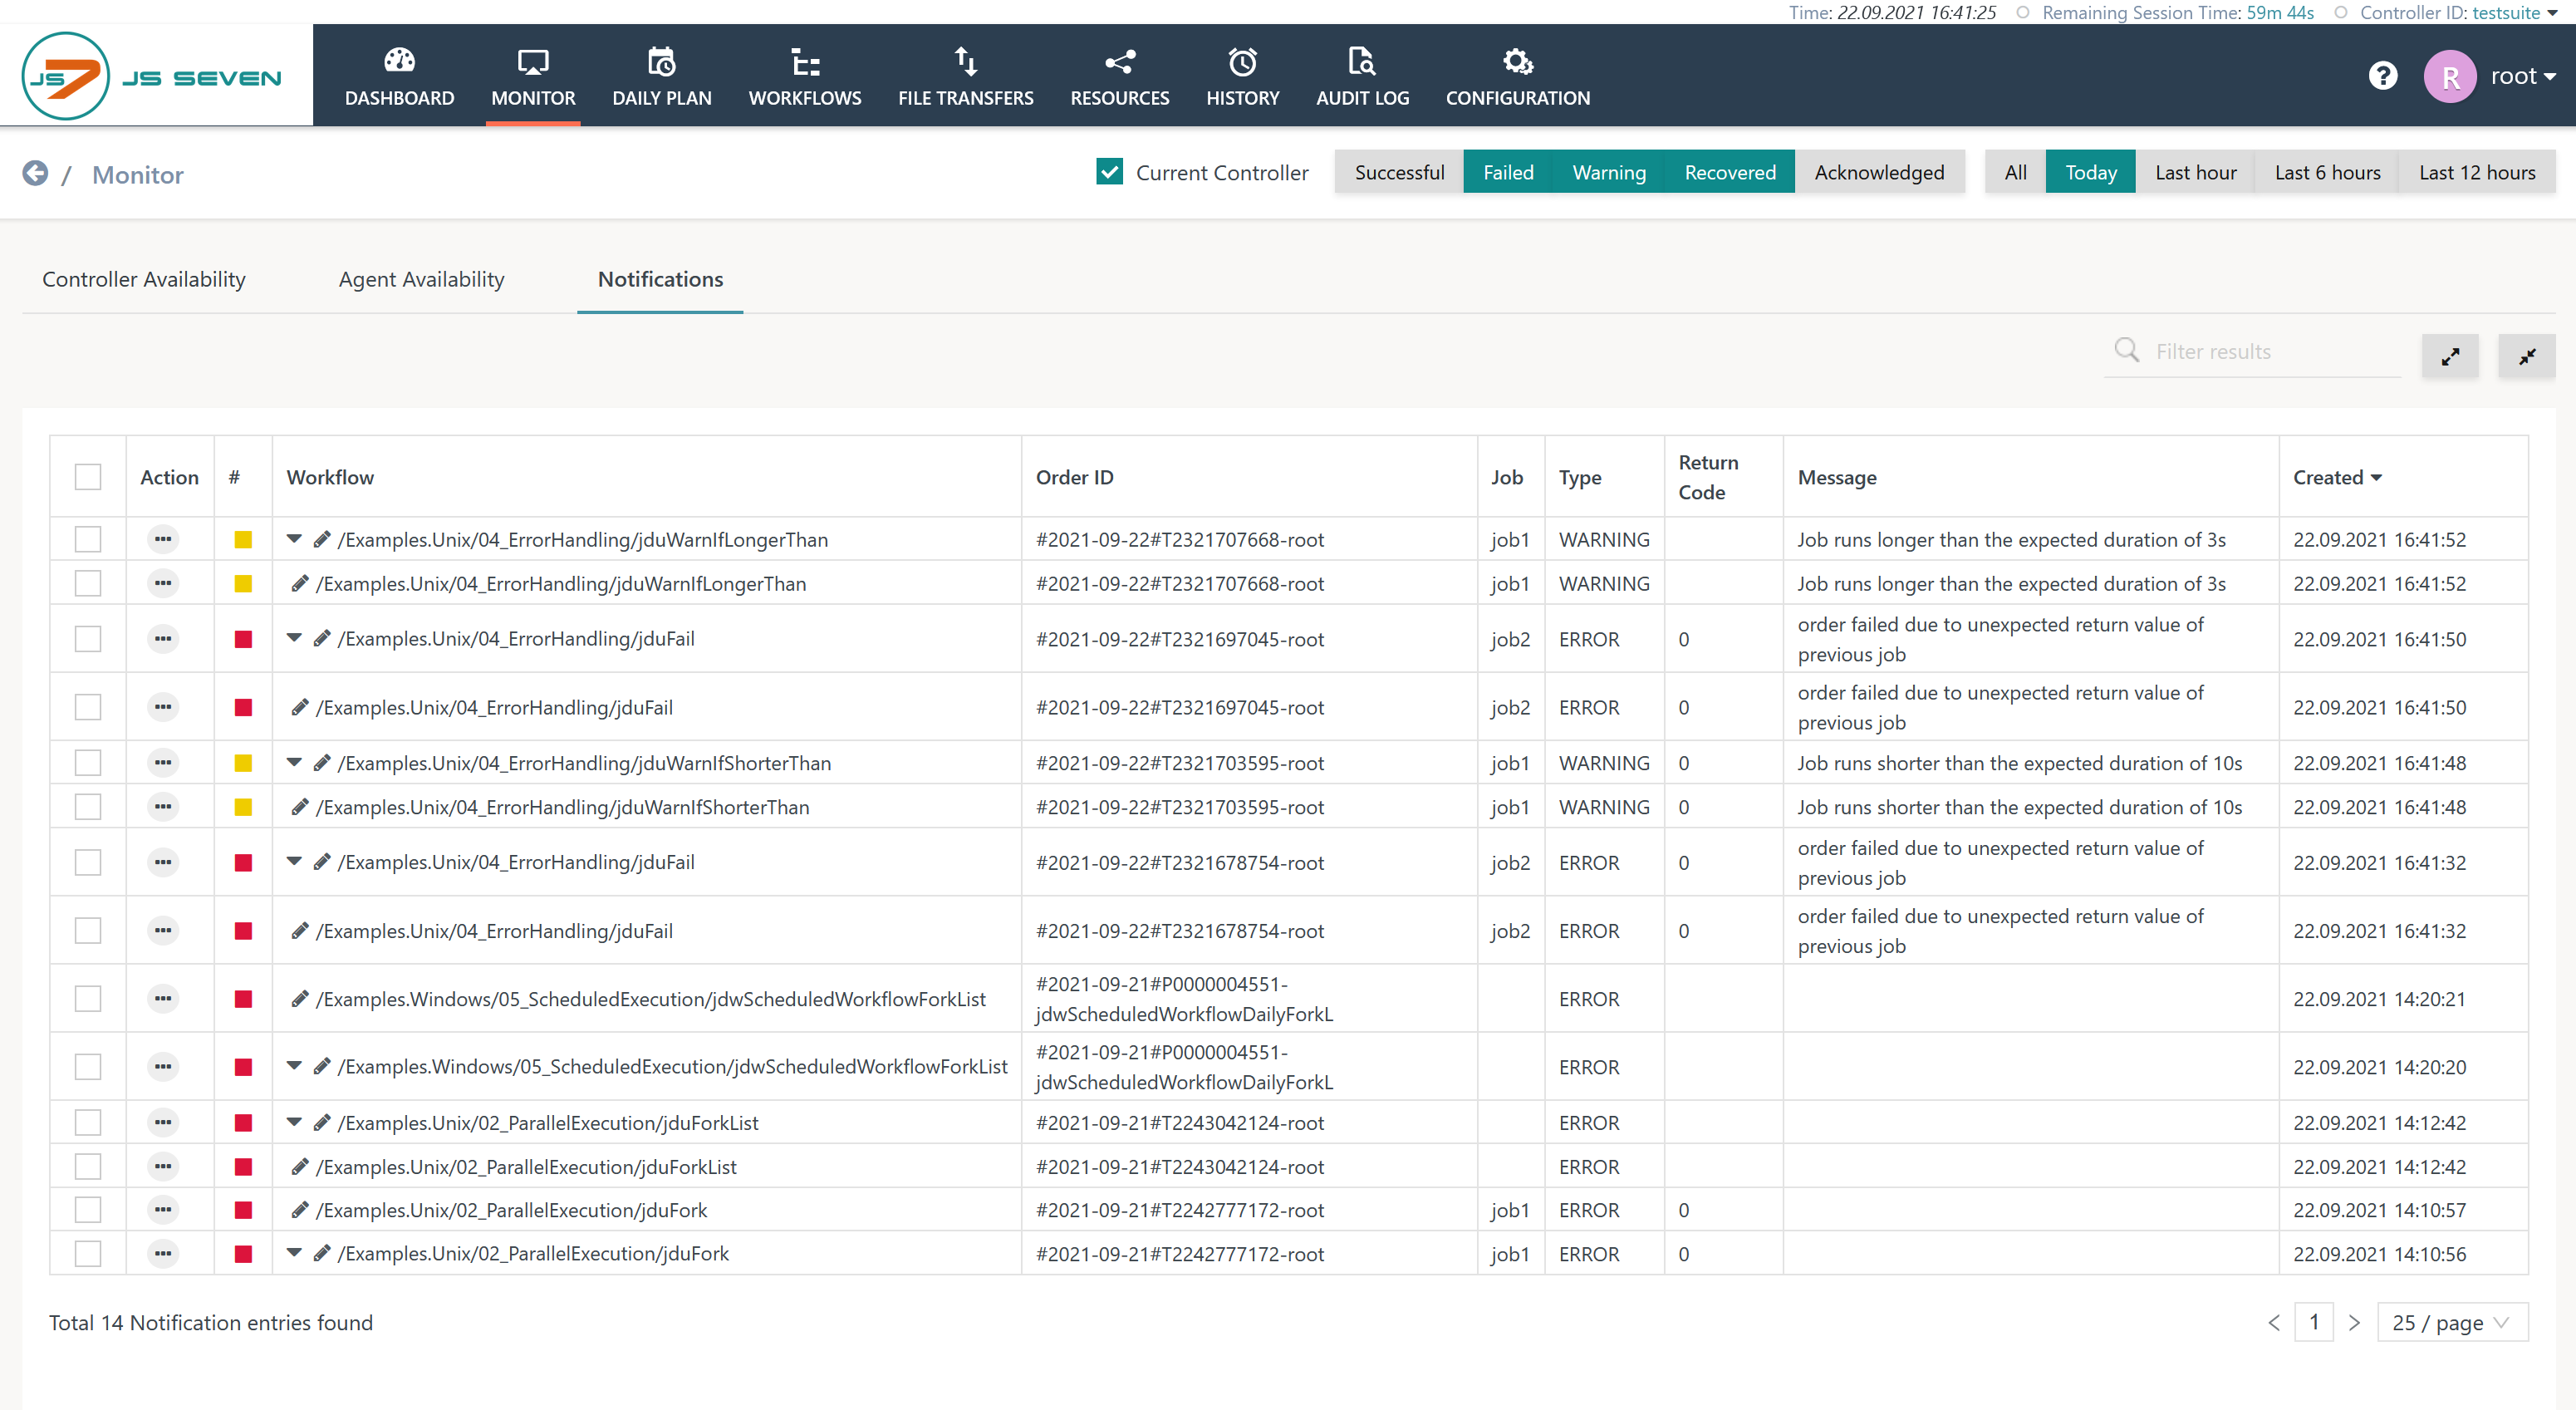
Explanation:
- The checkbox Current Controller checkbox limits the results displayed to notifications of the currently selected Controller, otherwise notifications are displayed for any all connected Controllers.
- Colors
- Yellow entries indicate warnings.
- Red entries indicate errors.
- Black entries indicate acknowledged errors.
- Actions
- The action menu of job error entries allows to Acknowledge an error to be Acknowledged and to add a comment that becomes visible with this view to be added.
- Acknowledged entries are removed from the list of entries and can be made visible using the Acknowledged filter.
- Lifetime
- The entries in this view are not collected for a longer time. By default notifications are automatically removed if older than 24 hours.
- For details see JS7 - Cleanup Service.
...
Overview
Content Tools