| Table of Contents | ||||||||||
|---|---|---|---|---|---|---|---|---|---|---|
|
Introduction
JobScheduler's memory and CPU usage depends on a number of factors:
...
Shell Job which processed 200 and 500 orders in parallel
Analysis
Memory without running JobScheduler job
Code Block
...
              total       used       free     shared    buffers     cached
 Mem:      10122748    1289088    8833660          0      43612     631104
 -/+ buffers/cache:     614372    9508376
 Swap:      2064376      26232    2038144
...
...
...
Test:
...
200
...
orders
...
in
...
200
...
tasks
...
in
...
parallel
...
Code Block
...
              total       used       free     shared    buffers     cached
 Mem:      10122748    1553944    8568804          0      43740     635880
 -/+ buffers/cache:     874324    9248424
 Swap:      2064376      26232    2038144
...
...
...
Test:
...
500
...
orders
...
in
...
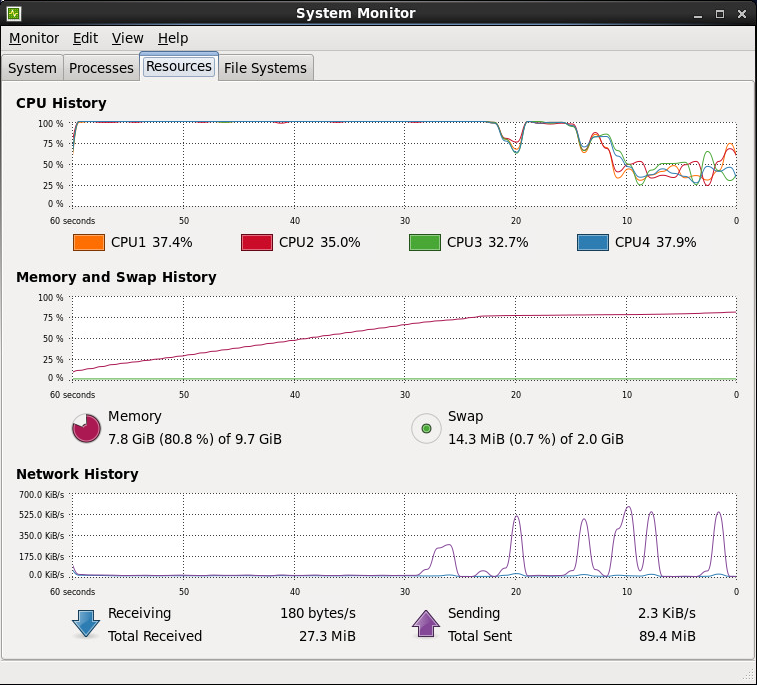
500
...
tasks
...
in
...
parallel
...
Code Block
...
              total       used       free     shared    buffers     cached
 Mem:      10122748    1967436    8155312          0      46268     655120
 -/+ buffers/cache:    1266048    8856700
 Swap:      2064376      26048    2038328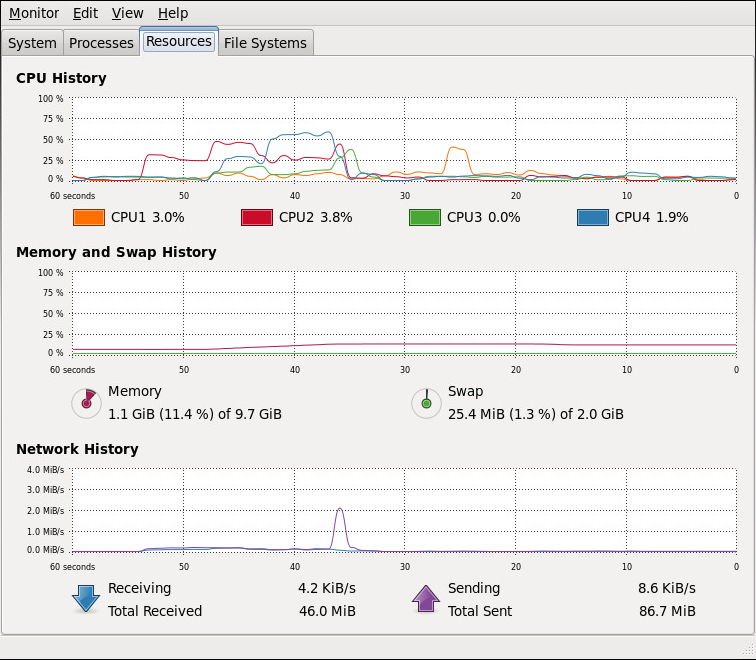
Java API Job which processed 100, 150 and 200 orders in parallel
Requirements
Configure the job with java_optionh1. "-Xmx32m" to avoid the error:
Code Block
...
# There is insufficient memory for the Java Runtime Environment to continue.
Edit the ~/.profile file of the JobScheduler user:
Code Block
...
ulimit -u 4096
...
...
and
...
edit
...
/etc/security/limits.conf
...
:
Code Block
...
 [JobScheduler user] soft nofile 4096
 [JobScheduler user] hard nofile 10240
...
...
to
...
avoid
...
the error:
Code Block
...
java.lang.OutOfMemoryError: unable to create new native thread
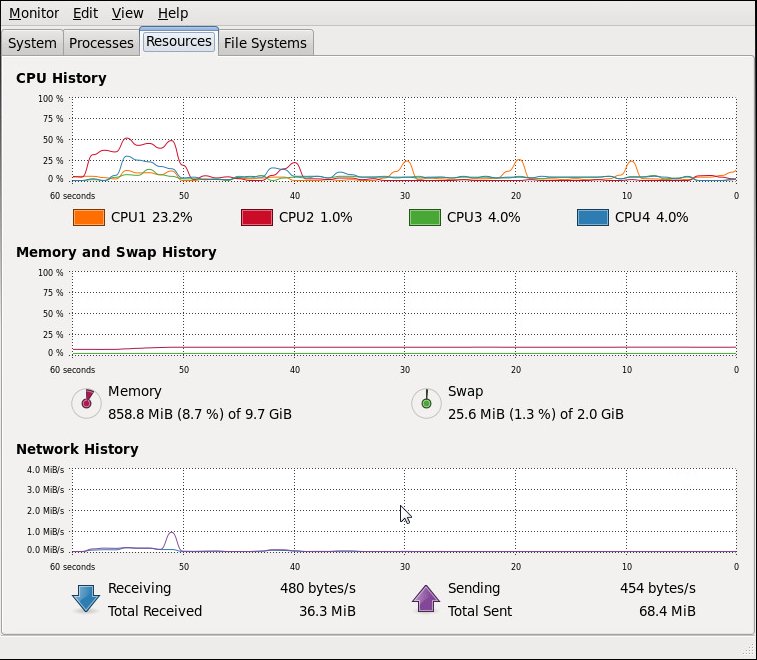
Analysis
Memory without running JobScheduler job
Code Block
...
              total       used       free     shared    buffers     cached
 Mem:      10122748    1576536    8546212          0      38836     695908
 -/+ buffers/cache:     841792    9280956
 Swap:      2064376          0    2064376
...
...
Test:
...
100
...
orders
...
in
...
100
...
tasks
...
in
...
parallel
...
Code Block
...
              total       used       free     shared    buffers     cached
 Mem:      10122748    3389660    6733088          0      38852     699960
 -/+ buffers/cache:    2650848    7471900
 Swap:      2064376          0    2064376
...
Test:
...
150
...
orders
...
in
...
150
...
tasks
...
in
...
parallel
...
Code Block
...
              total       used       free     shared    buffers     cached
 Mem:      10122748    7219820    2902928          0      27276     251860
 -/+ buffers/cache:    6940684    3182064
 Swap:      2064376          0    2064376
...
...
...
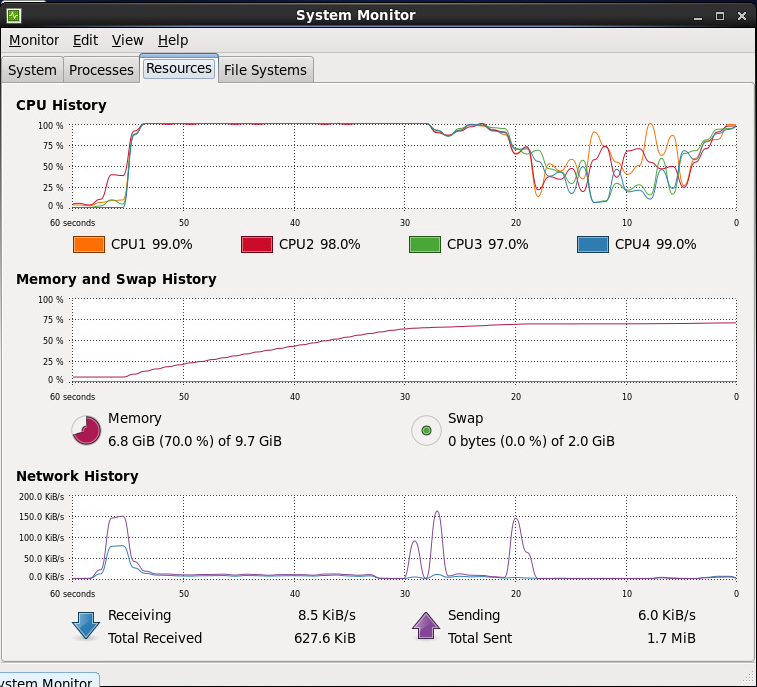
Test:
...
200
...
orders
...
in
...
200
...
tasks
...
in
...
parallel
...
Code Block
...
              total       used       free     shared    buffers     cached
 Mem:      10122748    9989012     133736          0      12600     245496
 -/+ buffers/cache:    9730916     391832
 Swap:      2064376      14032    2050344